---
title: Translate PromQL queries to NRQL
source: https://docs.newrelic.com/docs/infrastructure/prometheus-integrations/view-query-data/translate-promql-queries-nrql
---
Do you have a PromQL query you'd like to convert to [NRQL](https://docs.newrelic.com/docs/query-data/nrql-new-relic-query-language/getting-started/introduction-nrql)? This document provides examples that show you how to convert some common PromQL queries to NRQL queries. You can use our PromQL-style query language to explore your Prometheus OpenMetrics integration data along with other data sent to New Relic.
> #### 💡 TIP
>
> To run PromQL-style queries in [New Relic](https://docs.newrelic.com/docs/new-relic-one/use-new-relic-one/get-started/introduction-new-relic-one), use the [PromQL translator in the query builder](https://docs.newrelic.com/docs/infrastructure/prometheus-integrations/view-query-data/view-query-your-prometheus-data#view-ui).
## Prometheus and New Relic metric types [#compare]
The different metric types supported by Prometheus and New Relic are related to each other:
| New Relic | Prometheus | Description |
| ----------------- | ----------------------------- | --------------------------------------------------------------------------------------------------------------------------------------------------------------------------------------------------------------------------------------------------------------------------------------------------------- |
| Count | Counter | The Prometheus counter is a cumulative sum while the New Relic count is a delta sum. For example, if you see 2 requests in the first reporting period and 3 requests in the second reporting period. The Prometheus counter will report 2 and then 5, while the New Relic count will report 2 and then 3. |
| Gauge | Gauge | A Prometheus gauge is similar to a New Relic gauge. |
| Multiple counts | Histogram | Prometheus automatically maps a histogram to a set of counters. In New Relic, these counters should be changed to deltas and reported as counts. |
| Gauges and counts | Summary | Prometheus represents a Summary with a given `basename` as the following time series: - a `basename_sum` - a `basename_count` - and 0 or more of `basename{quantile=".xx"...}` metrics New Relic maps the `_sum` as a Summary, the `_count` as a Counter, and each quantile metric as a Gauge. |
| Summary | (No equivalent in Prometheus) | New Relic has a distinct metric type called a summary that is different than the Prometheus summary. It is designed for reporting aggregated discrete events so that you can query the count, sum, min, max, and average values. |
/\* To learn how to convert from a PromQL query to an NRQL alert condition that can be used with New Relic, watch this short video (approx. 5:45 minutes).
\*/
## Mapping between NRQL and our PromQL-style queries [#explore-data]
> #### 💡 TIP
>
> To see how New Relic translates PromQL-style queries to NRQL, write a query in
> the [query builder PromQL-style tab](#prom-ql-example), then switch to the [NRQL tab](https://docs.newrelic.com/docs/chart-builder/use-chart-builder/choose-data/use-advanced-nrql-mode-specify-data).
This table shows the mapping between NRQL and our PromQL-style queries when exploring data. For more contextual information, see the [examples](#prom-ql-example).
| Description | Mapping between NRQL and PromQL-style queries |
| -------------------------------------------------------------------------------------------------------------------------------------- | ----------------------------------------------------------------------------------------------------------------------------------------------------------------- |
| **Search for attributes:** Explore the attributes on the `container_memory_usage_bytes` metric. | - PromQL: ```promql container_memory_usage_bytes ``` - NRQL: ```sql FROM Metric SELECT keyset() WHERE metricName = 'container_memory_usage_bytes' ``` |
| **Find attribute's value:** Explore the current value of the `container_memory_usage_bytes` metric for unique `id` attributes. | - PromQL: ```promql sum(container_memory_usage_bytes) by (id) ``` - NRQL: ```sql FROM Metric SELECT sum(container_memory_usage_bytes) FACET id ``` |
| **Visualize the attribute's value:** Chart the value of the `container_memory_usage_bytes` metric with the given `id` attribute value. | - PromQL: ```promql container_memory_usage_bytes{id="/"} ``` - NRQL: ```sql FROM Metric SELECT latest(container_memory_usage_bytes) WHERE id = '/' TIMESERIES ``` |
**PromQL-style query example**
**1. Start your query.**
When exploring your data for a particular metric in PromQL, such as memory by container usage in bytes, you can start with a query such as:
````promql
container_memory_usage_bytes
```
This will chart all the unique metric time series for the input metric.
**2. Filter the query results.**
Looking at the data, you can add more query parameters to filter down the number of metric time series. For example, if you only want time series where the `id` is `/`, the PromQL-style query will be:
```promql
container_memory_usage_bytes{id="/"}
```
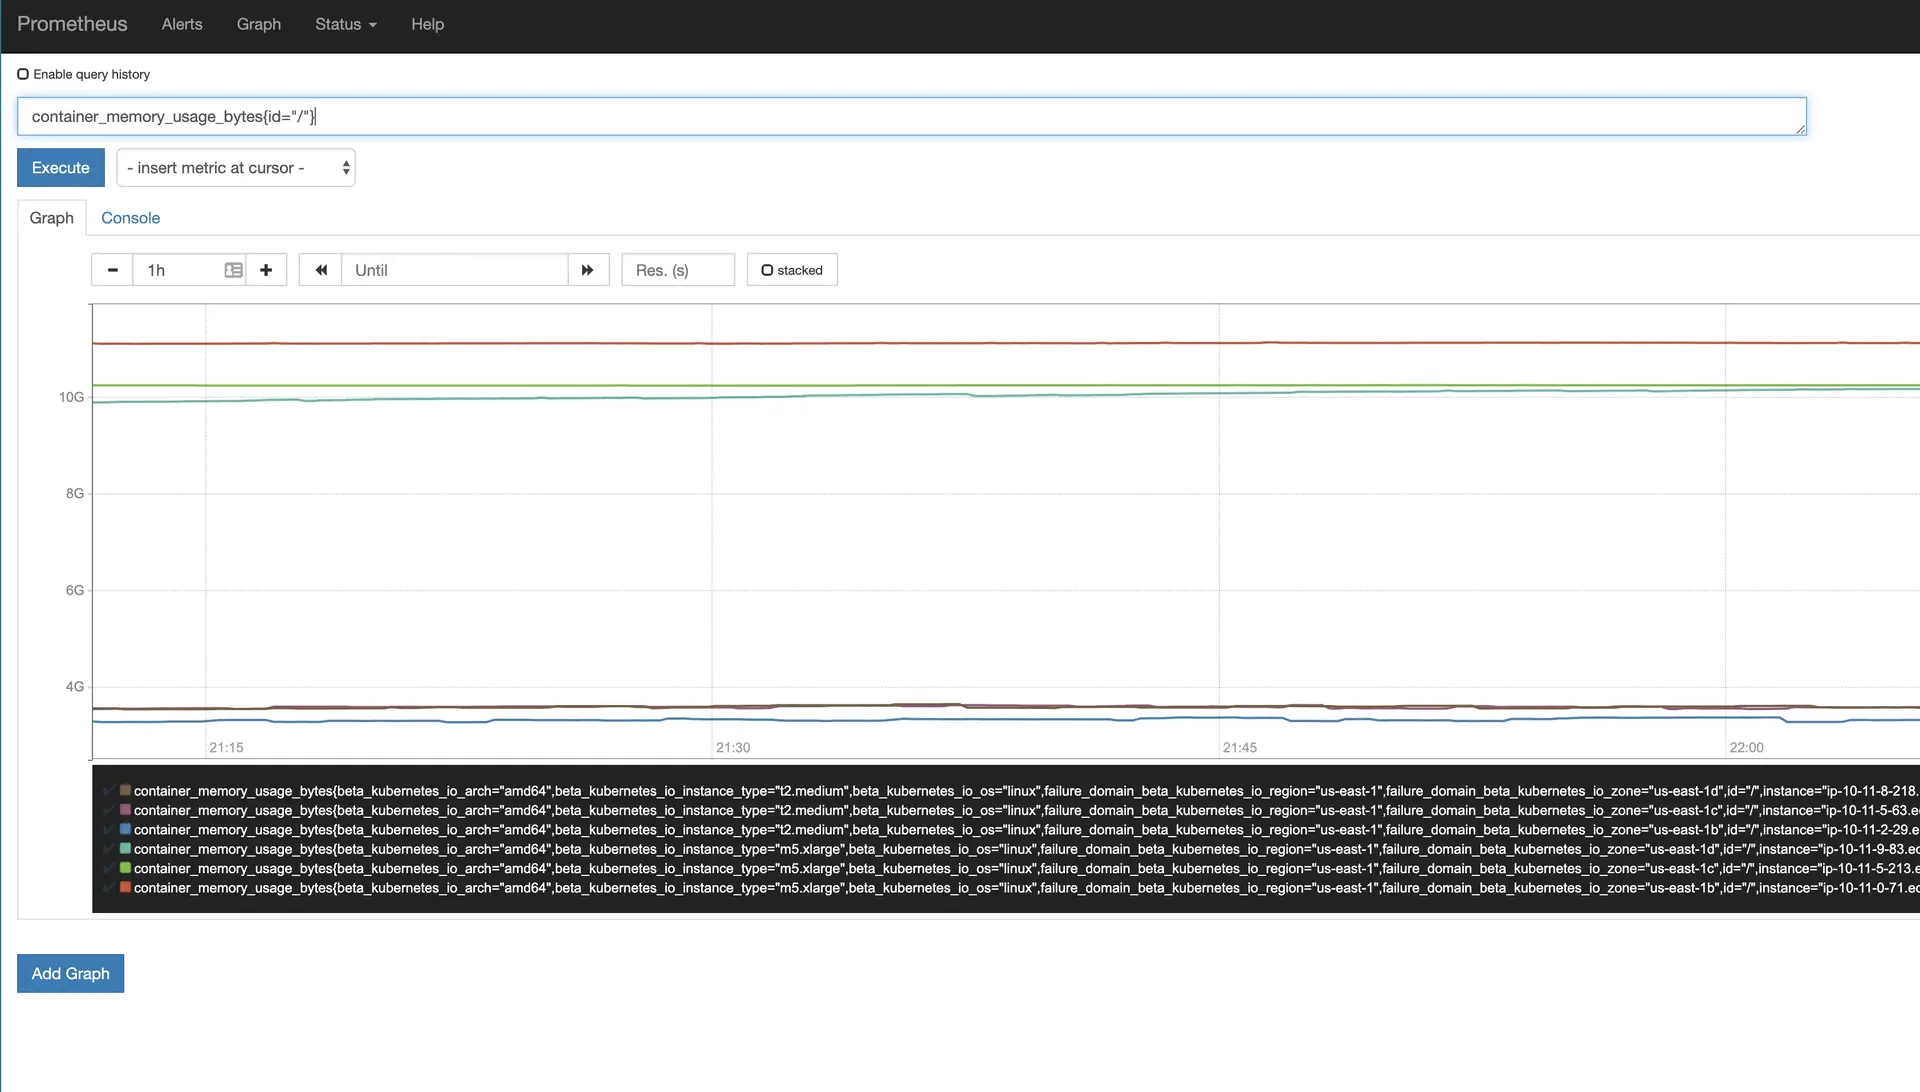 **PromQL-style example:** To filter the data, run this PromQL-style query: container_memory_usage_bytes{id="/"}.
````
**NRQL query example**
**1. Query available metrics.**
To explore your data, start by looking at all the available metrics. Use the following NRQL query:
````sql
FROM Metric SELECT uniques(metricName)
```
**2. Find unique attributes.**
Once you have found the metric you want to review, such as `container_memory_usage_bytes`, you can find the unique attributes with the following query:
```sql
FROM Metric SELECT keyset() WHERE metricName = 'container_memory_usage_bytes'
```
The results will show each available attribute key and the value type (string, boolean, or number).
**3. Aggregate and chart the metrics.**
To chart metrics using NRQL, you first need an aggregation function. For example, you can use `latest` for gauges, `sum` for counts, and `average` for summaries.
As the following chart shows, all the unique time series are aggregated into one unique time series by default:
**PromQL-style example:** To filter the data, run this PromQL-style query: container_memory_usage_bytes{id="/"}.
````
**NRQL query example**
**1. Query available metrics.**
To explore your data, start by looking at all the available metrics. Use the following NRQL query:
````sql
FROM Metric SELECT uniques(metricName)
```
**2. Find unique attributes.**
Once you have found the metric you want to review, such as `container_memory_usage_bytes`, you can find the unique attributes with the following query:
```sql
FROM Metric SELECT keyset() WHERE metricName = 'container_memory_usage_bytes'
```
The results will show each available attribute key and the value type (string, boolean, or number).
**3. Aggregate and chart the metrics.**
To chart metrics using NRQL, you first need an aggregation function. For example, you can use `latest` for gauges, `sum` for counts, and `average` for summaries.
As the following chart shows, all the unique time series are aggregated into one unique time series by default:
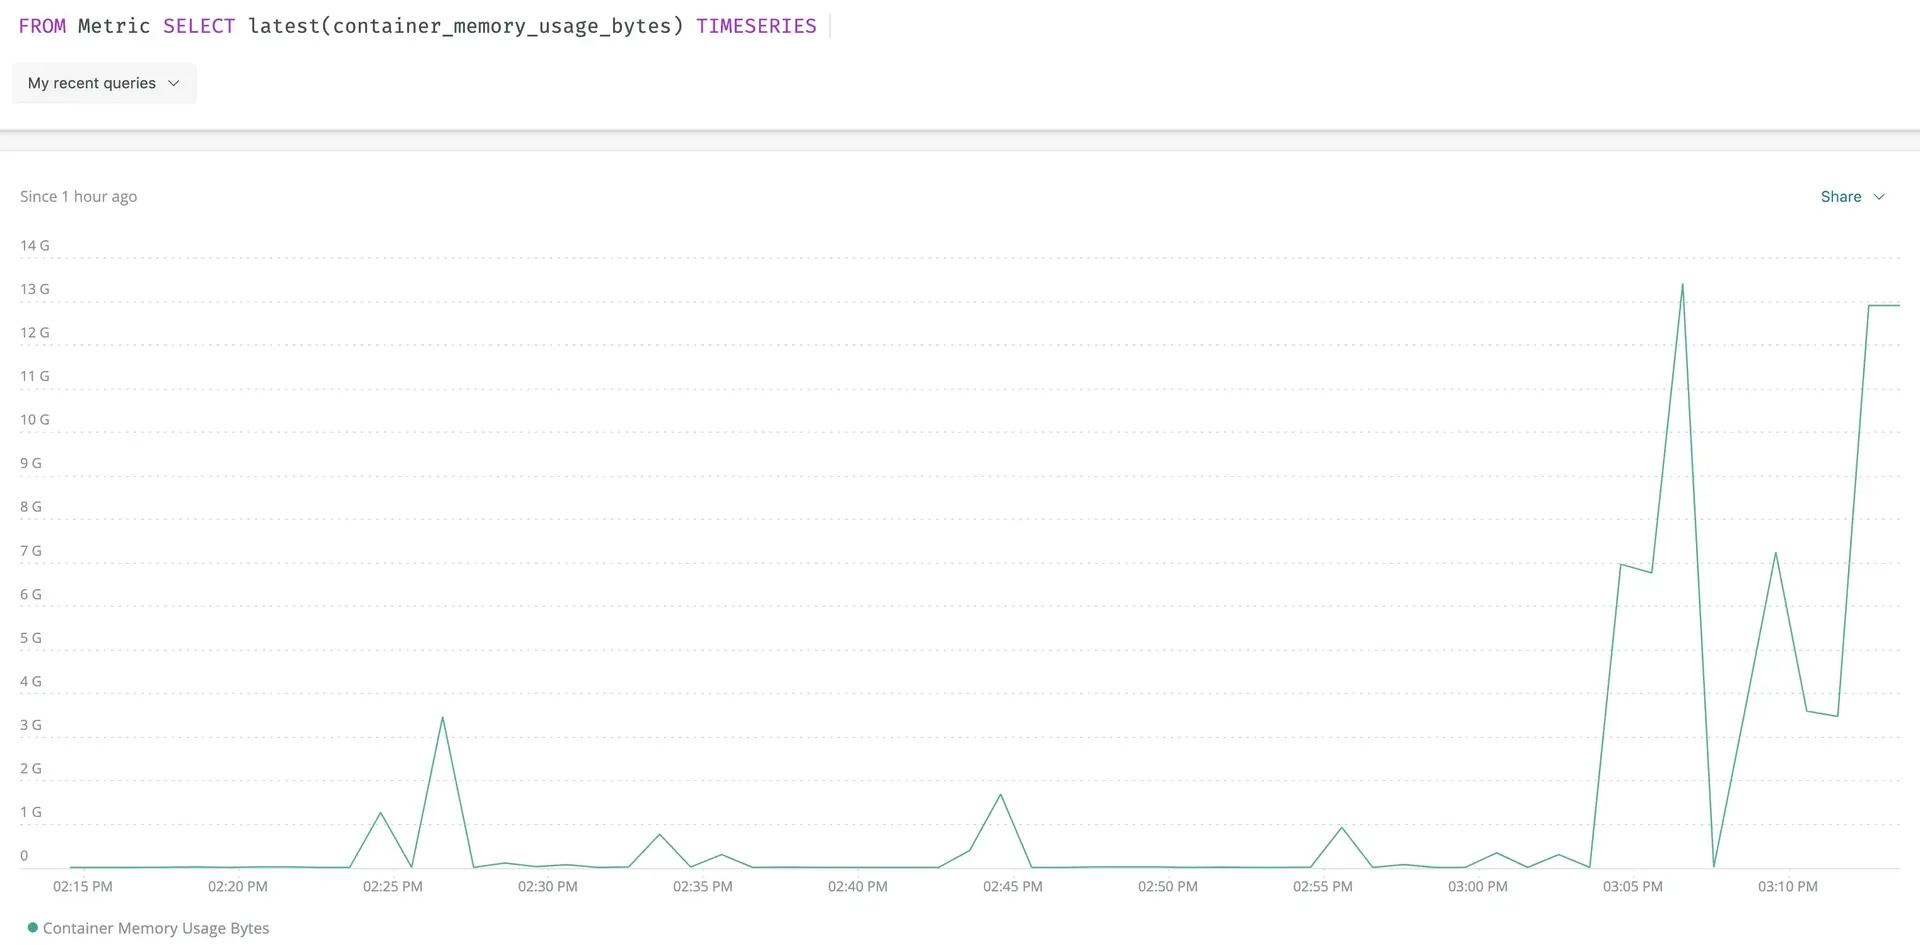 **[one.newrelic.com > All capabilities](https://one.newrelic.com/all-capabilities) > Query your data**: This example shows the data you see after running FROM Metric SELECT keyset() WHERE metricName = 'container_memory_usage_bytes'.
**4. View metrics by ID.**
To view the unique metric time series with various `id` values, run the following query:
```sql
FROM Metric SELECT latest(container_memory_usage_bytes) FACET id
```
**[one.newrelic.com > All capabilities](https://one.newrelic.com/all-capabilities) > Query your data**: This example shows the data you see after running FROM Metric SELECT keyset() WHERE metricName = 'container_memory_usage_bytes'.
**4. View metrics by ID.**
To view the unique metric time series with various `id` values, run the following query:
```sql
FROM Metric SELECT latest(container_memory_usage_bytes) FACET id
```
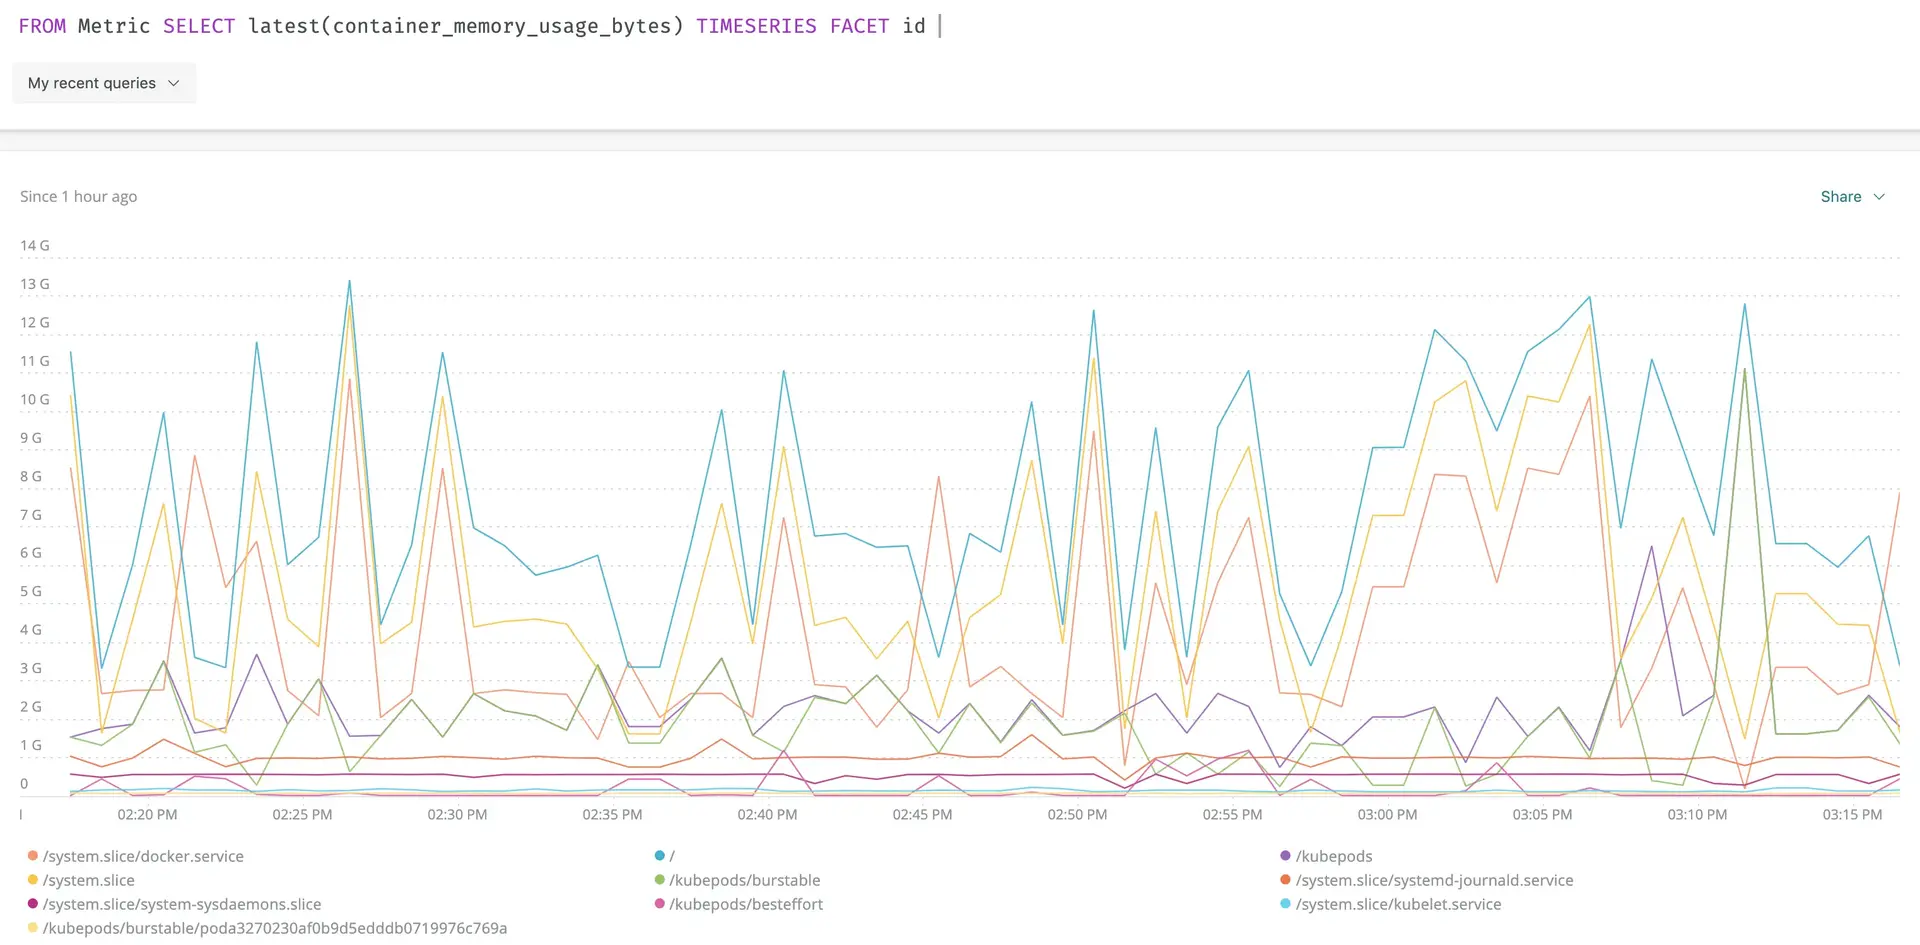 **[one.newrelic.com > All capabilities](https://one.newrelic.com/all-capabilities) > Query your data**: This example shows the data you see after running FROM Metric SELECT latest(container_memory_usage_bytes) FACET id.
**5. Add the selected ID to the query.**
Next you can select an `id` value and put it in the NRQL `WHERE` clause.
```sql
FROM Metric SELECT latest(container_memory_usage_bytes) WHERE id = "/" TIMESERIES
```
**[one.newrelic.com > All capabilities](https://one.newrelic.com/all-capabilities) > Query your data**: This example shows the data you see after running FROM Metric SELECT latest(container_memory_usage_bytes) FACET id.
**5. Add the selected ID to the query.**
Next you can select an `id` value and put it in the NRQL `WHERE` clause.
```sql
FROM Metric SELECT latest(container_memory_usage_bytes) WHERE id = "/" TIMESERIES
```
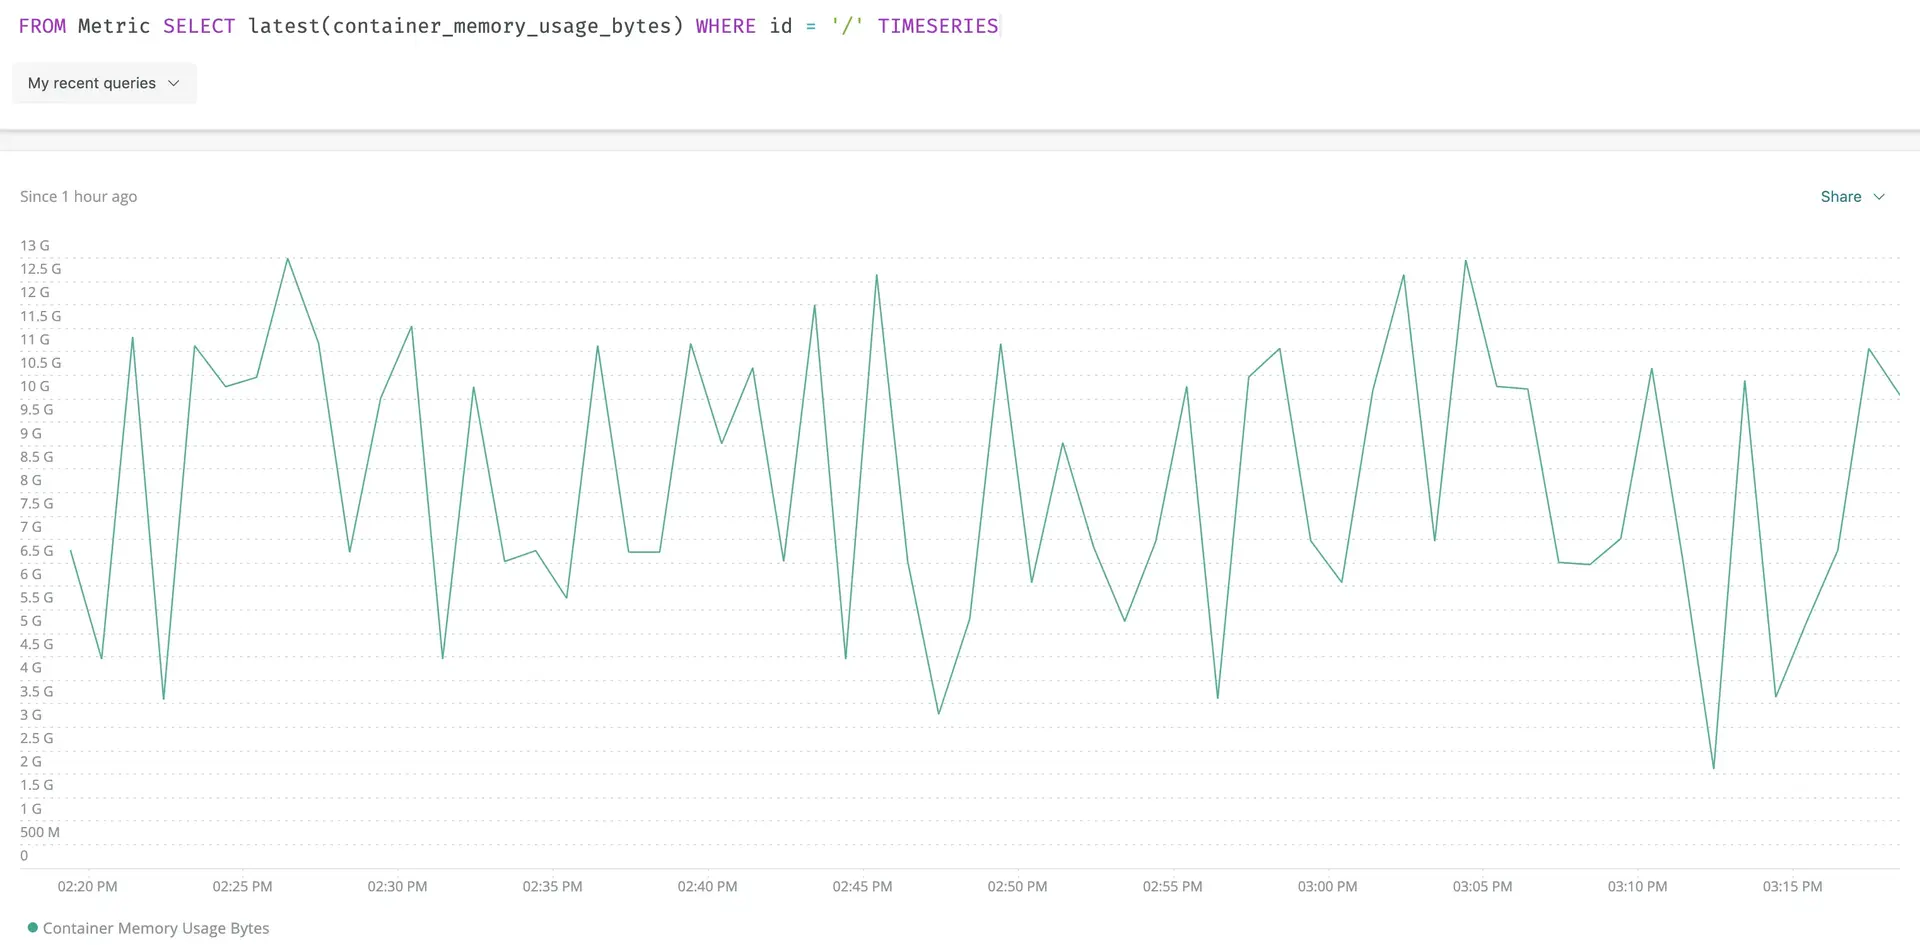 **[one.newrelic.com > All capabilities](https://one.newrelic.com/all-capabilities) > Query your data**: This example shows the data displayed after running `From Metric select latest(container_memory_usage_bytes) where id = "/" TIMESERIES`.
````
## Filter examples [#filter-data]
Both our PromQL-style query language and NRQL provide syntax to filter down the number of unique metric time series.
- PromQL-style uses brackets to filter.
- NRQL uses a `WHERE` clause.
Here are some example queries:
| Description | PromQL-style and NRQL queries |
| ---------------------------------------- | --------------------------------------------------------------------------------------------------------------------------------------------------------------------------------------------------------------------------------------------------------------------------------------------------------------------------------------------------------------------------------------------------------------------------------------------------------------------------------------------------------------------------------------- |
| Select data with specific values. | - PromQL: ```promql go_memstats_heap_alloc_bytes{job="apiserver", instance="1234"}) ``` - NRQL: To only select data with specific values in NRQL, use the `WHERE` clause with `=`. In this example, all data must have the selected value for job and handler. ```sql FROM Metric SELECT latest(go_memstats_heap_alloc_bytes) WHERE job = 'apiserver' AND instance = '1234' TIMESERIES ``` |
| Select data with multiple values. | - PromQL: ```promql go_memstats_heap_alloc_bytes{environment=~"staging|testing|development",method!="GET"} ``` - NRQL: In NRQL use the `in` clause to select multiple values for an attribute and the `!=` sign to select all values but the one listed. In this example, the environment can be `staging`, `testing`, or `development`, and the method cannot be `GET`. ```sql FROM Metric SELECT latest(go_memstats_heap_alloc_bytes) WHERE environment IN ('staging', 'testing', 'development') AND method != 'GET' TIMESERIES ``` |
| Select data using partial string values. | - PromQL: ```promql go_memstats_heap_alloc_bytes{job=~"api.*"} ``` - NRQL: In NRQL use the `LIKE` clause to match part of a string value. In this example, all data will be returned where the job attributes start with `api`. ```sql FROM Metric SELECT latest(go_memstats_heap_alloc_bytes) WHERE job LIKE 'api%' TIMESERIES ``` |
## PromQL-style to NRQL query examples [#examples]
You can simulate the following PromQL-style queries with NRQL queries:
| Description | PromQL-style and NRQL queries |
| --------------------------------------------------------------------------------------------------------------------- | --------------------------------------------------------------------------------------------------------------------------------------------------------------------------------------------------------------------------------------------------------------------------------------------------------------------------- |
| Measure the per second rate over the last minute of the `http_request_total` metric. | - PromQL: ```promql sum(rate(http_requests_total[1m])) ``` - NRQL: ```sql FROM Metric SELECT rate(sum(http_request_total), 1 second) TIMESERIES 1 minute ``` |
| Chart the difference of the two metrics, then divide by 1024. | - PromQL: ```promql (instance_memory_limit_bytes - instance_memory_usage_bytes) / 1024 ``` - NRQL: ```sql FROM Metric SELECT (latest(instance_memory_limit_bytes) - latest(instance_memory_usage_bytes)) / 1024 TIMESERIES ``` |
| Provide the summed rate per 30-second interval by each handler. | - PromQL: ```promql sum(rate(http_requests_total[30s])) by (handler) ``` - NRQL: ```sql FROM Metric SELECT rate(sum(http_requests_total), 30 seconds) FACET handler TIMESERIES ``` |
| Chart the difference in the two metrics where the instance is named `foo` and the `fstype` is either `ext4` or `xfs`. | - PromQL: ```promql (node_filesystem_free_bytes{instance='foo',fstype=~"ext4|xfs"} / node_filesystem_size_bytes{instance='foo',fstype=~"ext4|xfs"}) ``` - NRQL: ```sql FROM Metric SELECT latest(node_filesystem_free_bytes) / latest(node_filesystem_size_bytes) WHERE instance = 'foo' AND fstype IN ('ext4', 'xfs') ``` |
**[one.newrelic.com > All capabilities](https://one.newrelic.com/all-capabilities) > Query your data**: This example shows the data displayed after running `From Metric select latest(container_memory_usage_bytes) where id = "/" TIMESERIES`.
````
## Filter examples [#filter-data]
Both our PromQL-style query language and NRQL provide syntax to filter down the number of unique metric time series.
- PromQL-style uses brackets to filter.
- NRQL uses a `WHERE` clause.
Here are some example queries:
| Description | PromQL-style and NRQL queries |
| ---------------------------------------- | --------------------------------------------------------------------------------------------------------------------------------------------------------------------------------------------------------------------------------------------------------------------------------------------------------------------------------------------------------------------------------------------------------------------------------------------------------------------------------------------------------------------------------------- |
| Select data with specific values. | - PromQL: ```promql go_memstats_heap_alloc_bytes{job="apiserver", instance="1234"}) ``` - NRQL: To only select data with specific values in NRQL, use the `WHERE` clause with `=`. In this example, all data must have the selected value for job and handler. ```sql FROM Metric SELECT latest(go_memstats_heap_alloc_bytes) WHERE job = 'apiserver' AND instance = '1234' TIMESERIES ``` |
| Select data with multiple values. | - PromQL: ```promql go_memstats_heap_alloc_bytes{environment=~"staging|testing|development",method!="GET"} ``` - NRQL: In NRQL use the `in` clause to select multiple values for an attribute and the `!=` sign to select all values but the one listed. In this example, the environment can be `staging`, `testing`, or `development`, and the method cannot be `GET`. ```sql FROM Metric SELECT latest(go_memstats_heap_alloc_bytes) WHERE environment IN ('staging', 'testing', 'development') AND method != 'GET' TIMESERIES ``` |
| Select data using partial string values. | - PromQL: ```promql go_memstats_heap_alloc_bytes{job=~"api.*"} ``` - NRQL: In NRQL use the `LIKE` clause to match part of a string value. In this example, all data will be returned where the job attributes start with `api`. ```sql FROM Metric SELECT latest(go_memstats_heap_alloc_bytes) WHERE job LIKE 'api%' TIMESERIES ``` |
## PromQL-style to NRQL query examples [#examples]
You can simulate the following PromQL-style queries with NRQL queries:
| Description | PromQL-style and NRQL queries |
| --------------------------------------------------------------------------------------------------------------------- | --------------------------------------------------------------------------------------------------------------------------------------------------------------------------------------------------------------------------------------------------------------------------------------------------------------------------- |
| Measure the per second rate over the last minute of the `http_request_total` metric. | - PromQL: ```promql sum(rate(http_requests_total[1m])) ``` - NRQL: ```sql FROM Metric SELECT rate(sum(http_request_total), 1 second) TIMESERIES 1 minute ``` |
| Chart the difference of the two metrics, then divide by 1024. | - PromQL: ```promql (instance_memory_limit_bytes - instance_memory_usage_bytes) / 1024 ``` - NRQL: ```sql FROM Metric SELECT (latest(instance_memory_limit_bytes) - latest(instance_memory_usage_bytes)) / 1024 TIMESERIES ``` |
| Provide the summed rate per 30-second interval by each handler. | - PromQL: ```promql sum(rate(http_requests_total[30s])) by (handler) ``` - NRQL: ```sql FROM Metric SELECT rate(sum(http_requests_total), 30 seconds) FACET handler TIMESERIES ``` |
| Chart the difference in the two metrics where the instance is named `foo` and the `fstype` is either `ext4` or `xfs`. | - PromQL: ```promql (node_filesystem_free_bytes{instance='foo',fstype=~"ext4|xfs"} / node_filesystem_size_bytes{instance='foo',fstype=~"ext4|xfs"}) ``` - NRQL: ```sql FROM Metric SELECT latest(node_filesystem_free_bytes) / latest(node_filesystem_size_bytes) WHERE instance = 'foo' AND fstype IN ('ext4', 'xfs') ``` |