The rate() function aggregates occurrences of an event into buckets based on time windows. You can use this to visualize the frequency of event occurrences. For example, you can view how many errors occurred per hour in the past day. You can get a lot of use out of this function in NRQL if you have large windows of time you'd like to monitor, but need to visualize smaller periods of time within those larger windows.
Use the rate() function
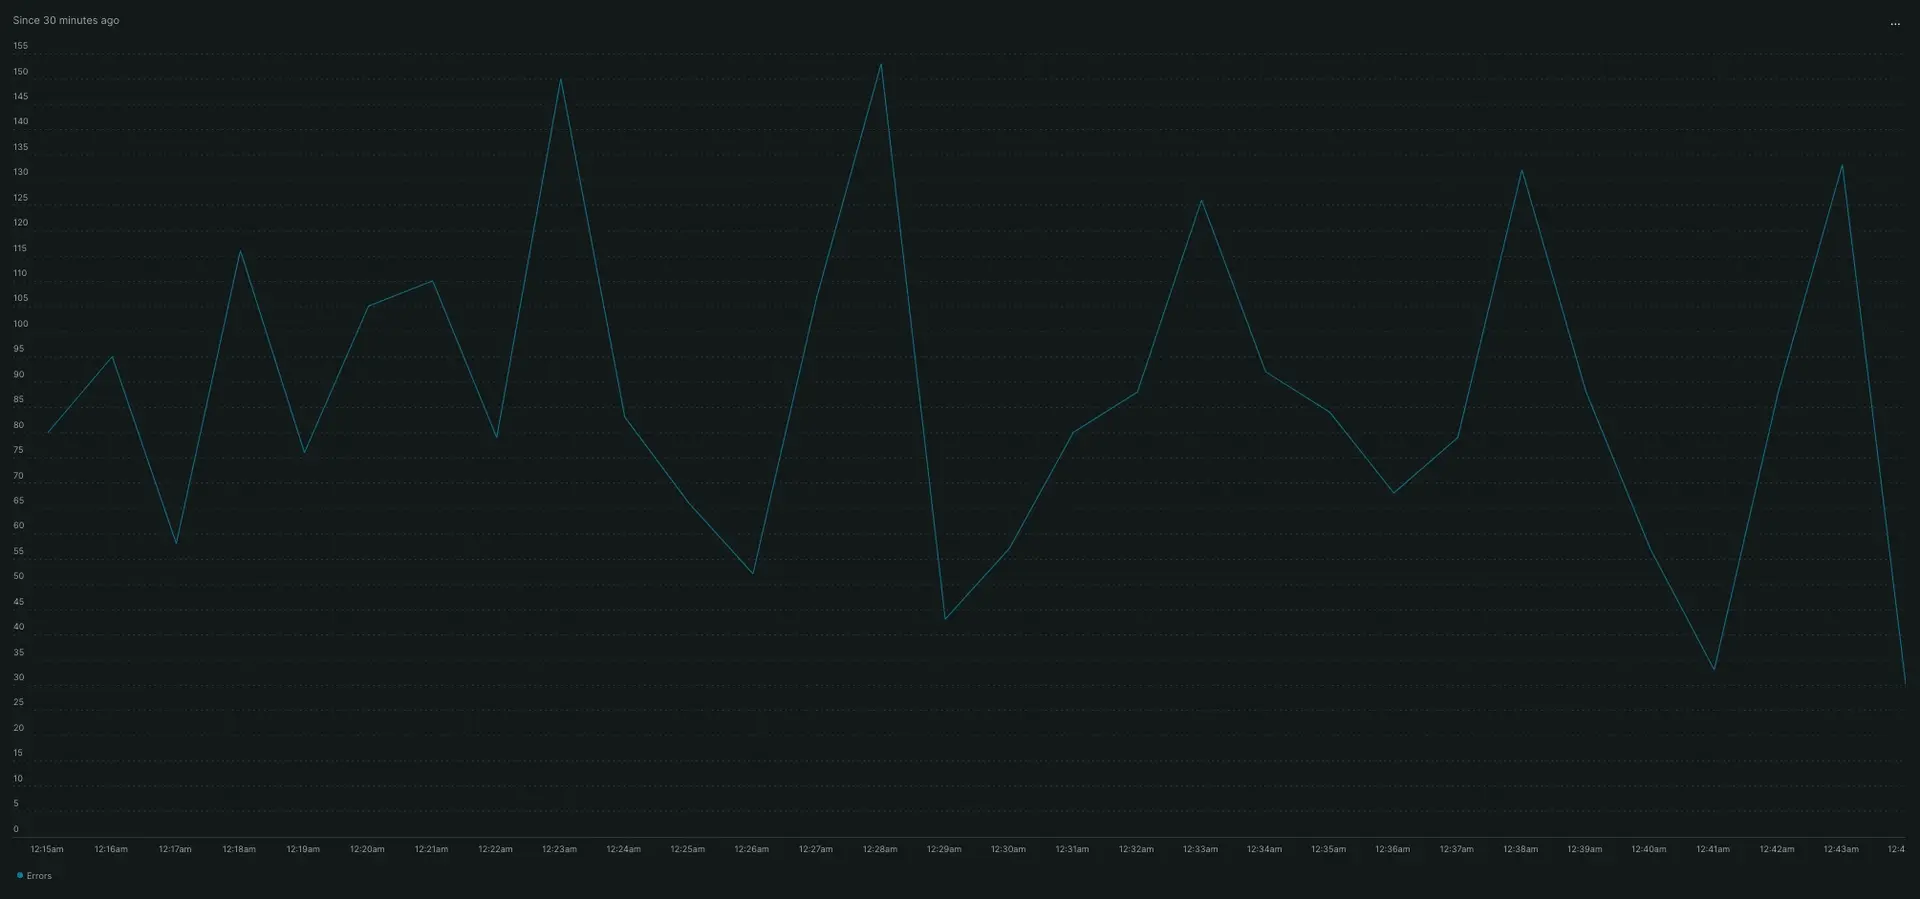
When using rate(), you can use the TIMESERIES keyword to generate a line chart with rates over time. Omitting TIMESERIES will generate a billboard view showing a single rate value averaged over time. Here's a query that will visualize transaction errors per minute over the last 30 minutes in a line chart form:
SELECT rate(count(*), 1 minute) AS 'Errors' FROM TransactionError TIMESERIES SINCE 30 minutes ago
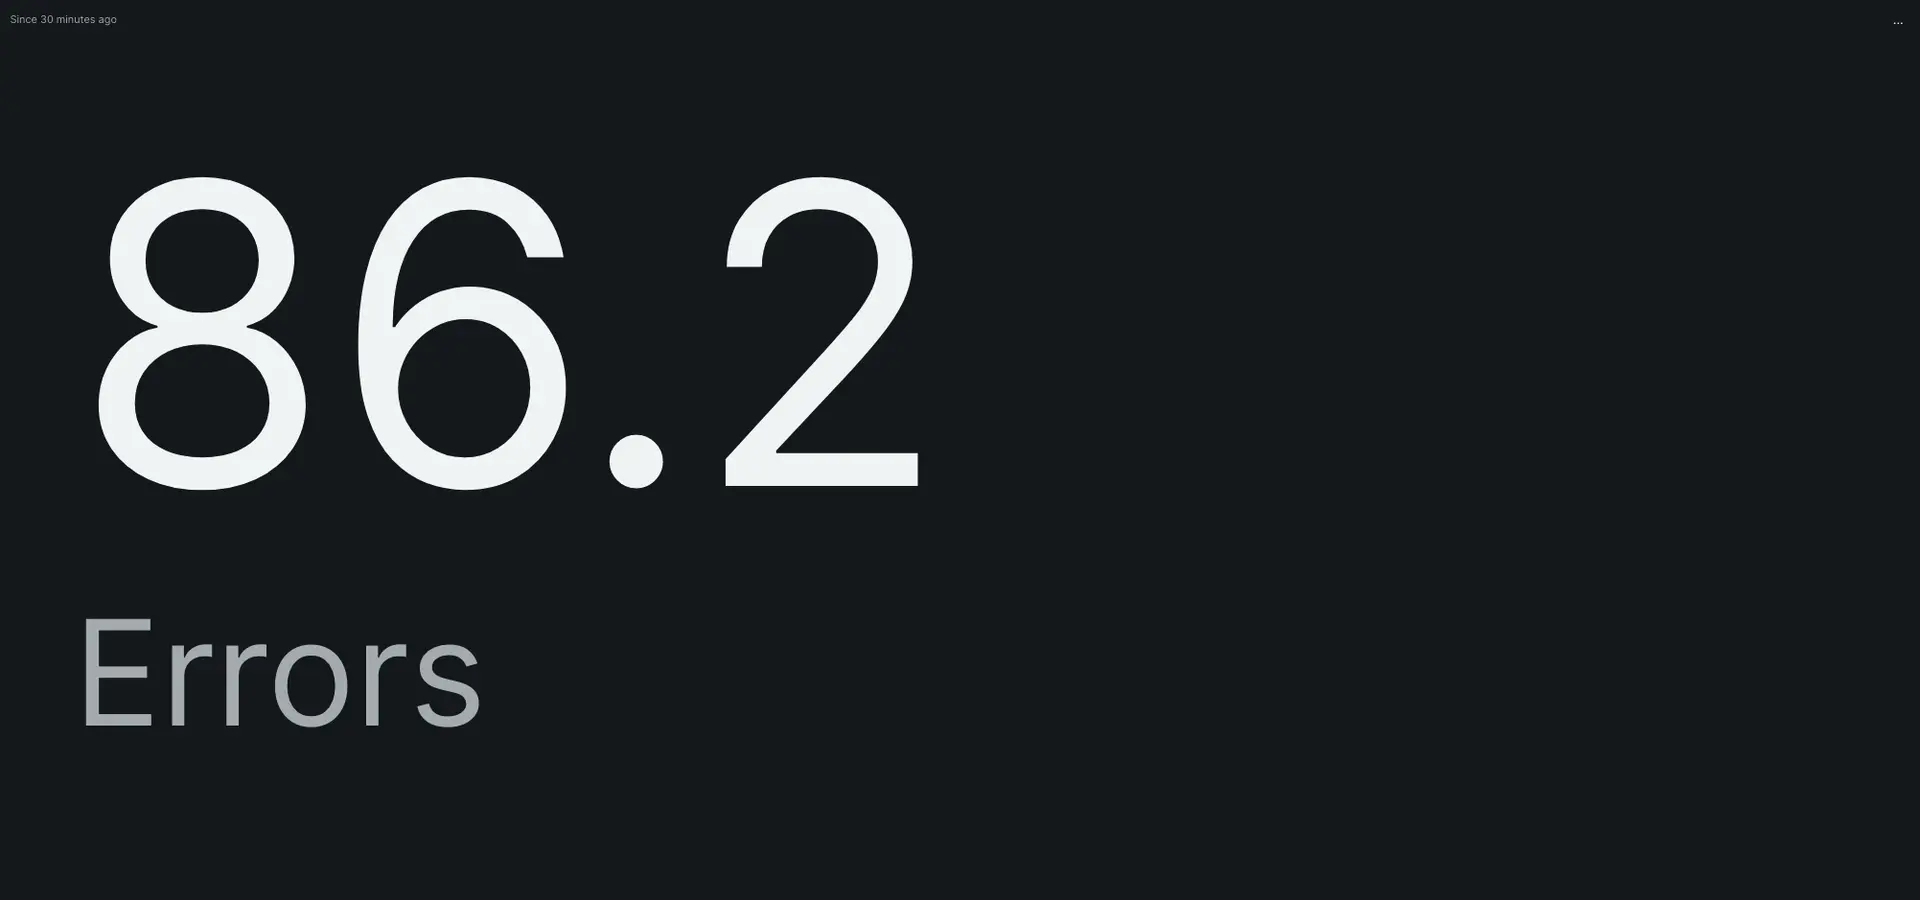
Running the same query without including TIMESERIES will display a single value representing the average occurrences over a period of time.
Use latestRate() to track rate of change
The latestRate() function uses a specified attribute and time interval to return the rate of change of a value over the two most recent data points. The function's units will be in change in attribute / time window. You can use this function to see leading-edge trends.
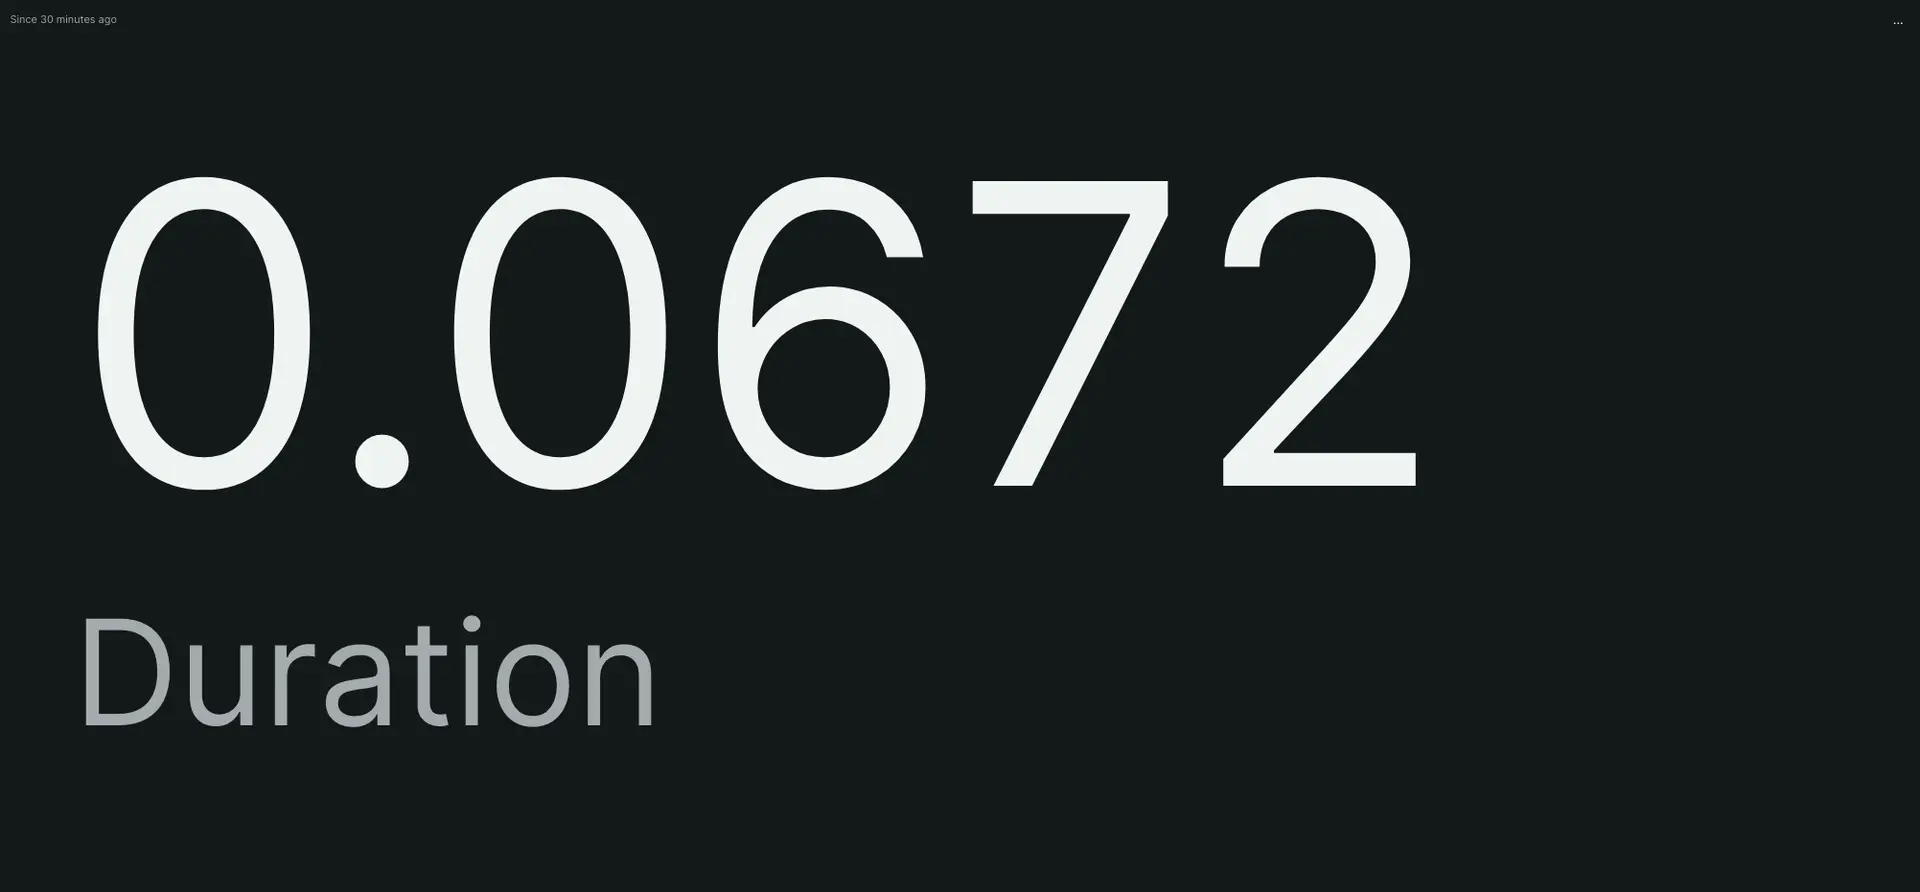
Here's an example query that will return the change in duration per second for the past two transaction errors:
Important
Remember that the latestRate() function uses the two most recent datapoints with sometimes volatile results. Consider just using rate() if you'd like an average over larger buckets of event occurrences.

