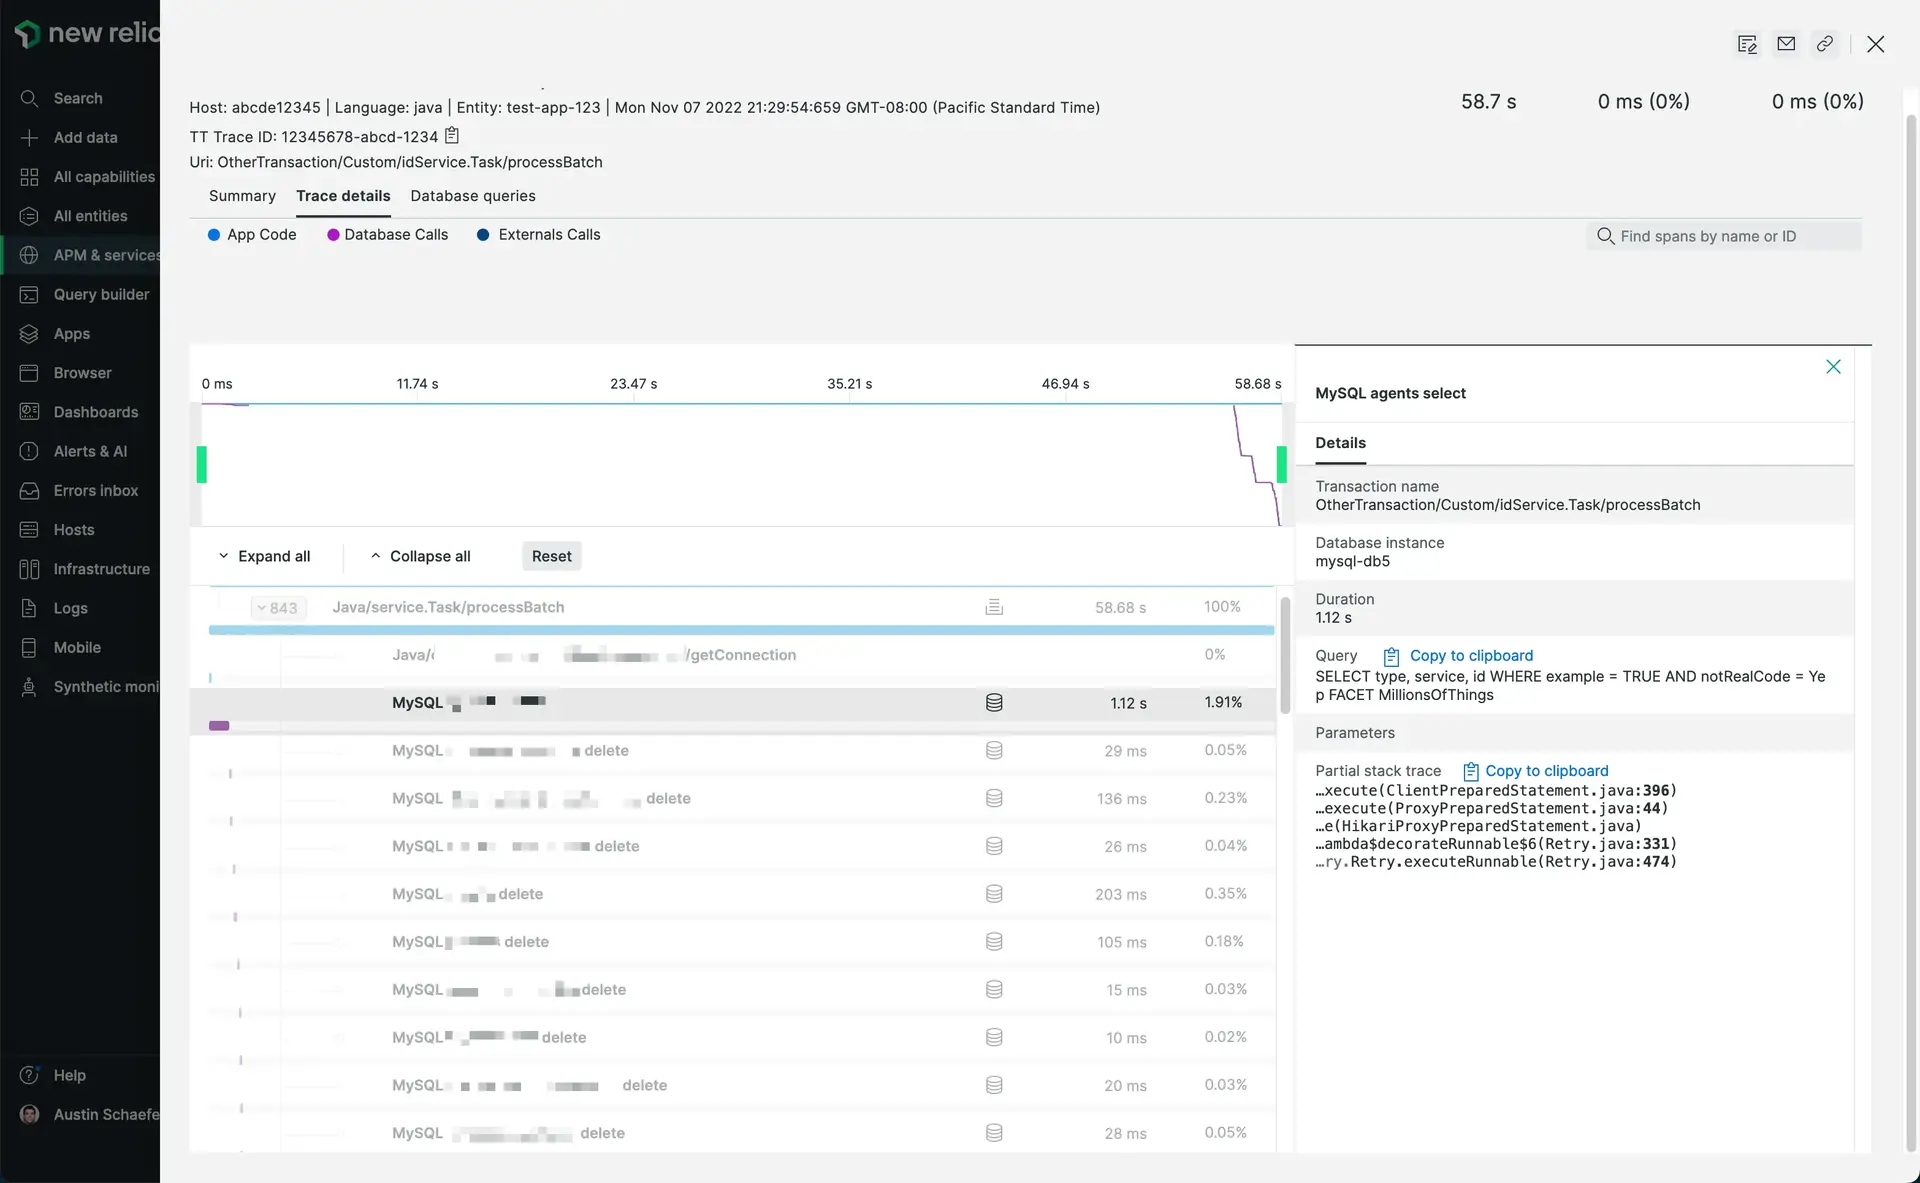
When you are part of a development, operations, or devops team, database issues need to be investigated quickly. To resolve performance problems and errors with a slow or failing app, you need to be able to analyze whether the underlying cause is related to database performance, one or more hosts or services, or both.
Using APM's transaction traces, slow query traces, and service maps, you can examine the specific query, database instance (host and port), and database name for the problem. APM's instance-level metrics can help you drill down to the specific instance or instances that are involved. This helps you quickly assess the impact and resolve the issue.

Compatibility and requirements
New Relic collects instance details for a variety of databases and database drivers. The ability to view specific instances and the types of database information in APM depends on your database driver and agent version:
- Go: See Go agent instance-level compatibility for datastores.
- Java: See Java agent instance-level compatibility for databases.
- .NET: See .NET agent instance-level compatibility for datastores.
- Node.js: See Node.js agent instance-level compatibility for datastores.
- PHP: See PHP agent instance-level compatibility for databases.
- Python: See Python agent instance-level compatibility for databases and packages.
- Ruby: See Ruby agent instance-level compatibility for ORMs and gems.
To request instance-level information from datastores currently not listed for your agent, get support at support.newrelic.com.
Use datastore instance details to monitor and troubleshoot your app
Use these examples as starting points to monitor and troubleshoot the performance of connections between your applications and associated datastore instances. The examples describe the New Relic capabilities that can help you determine whether the underlying cause behind app performance problems relates to your applications, a database instance configuration problem (such as a missing index), your organizations resources, or a combination.