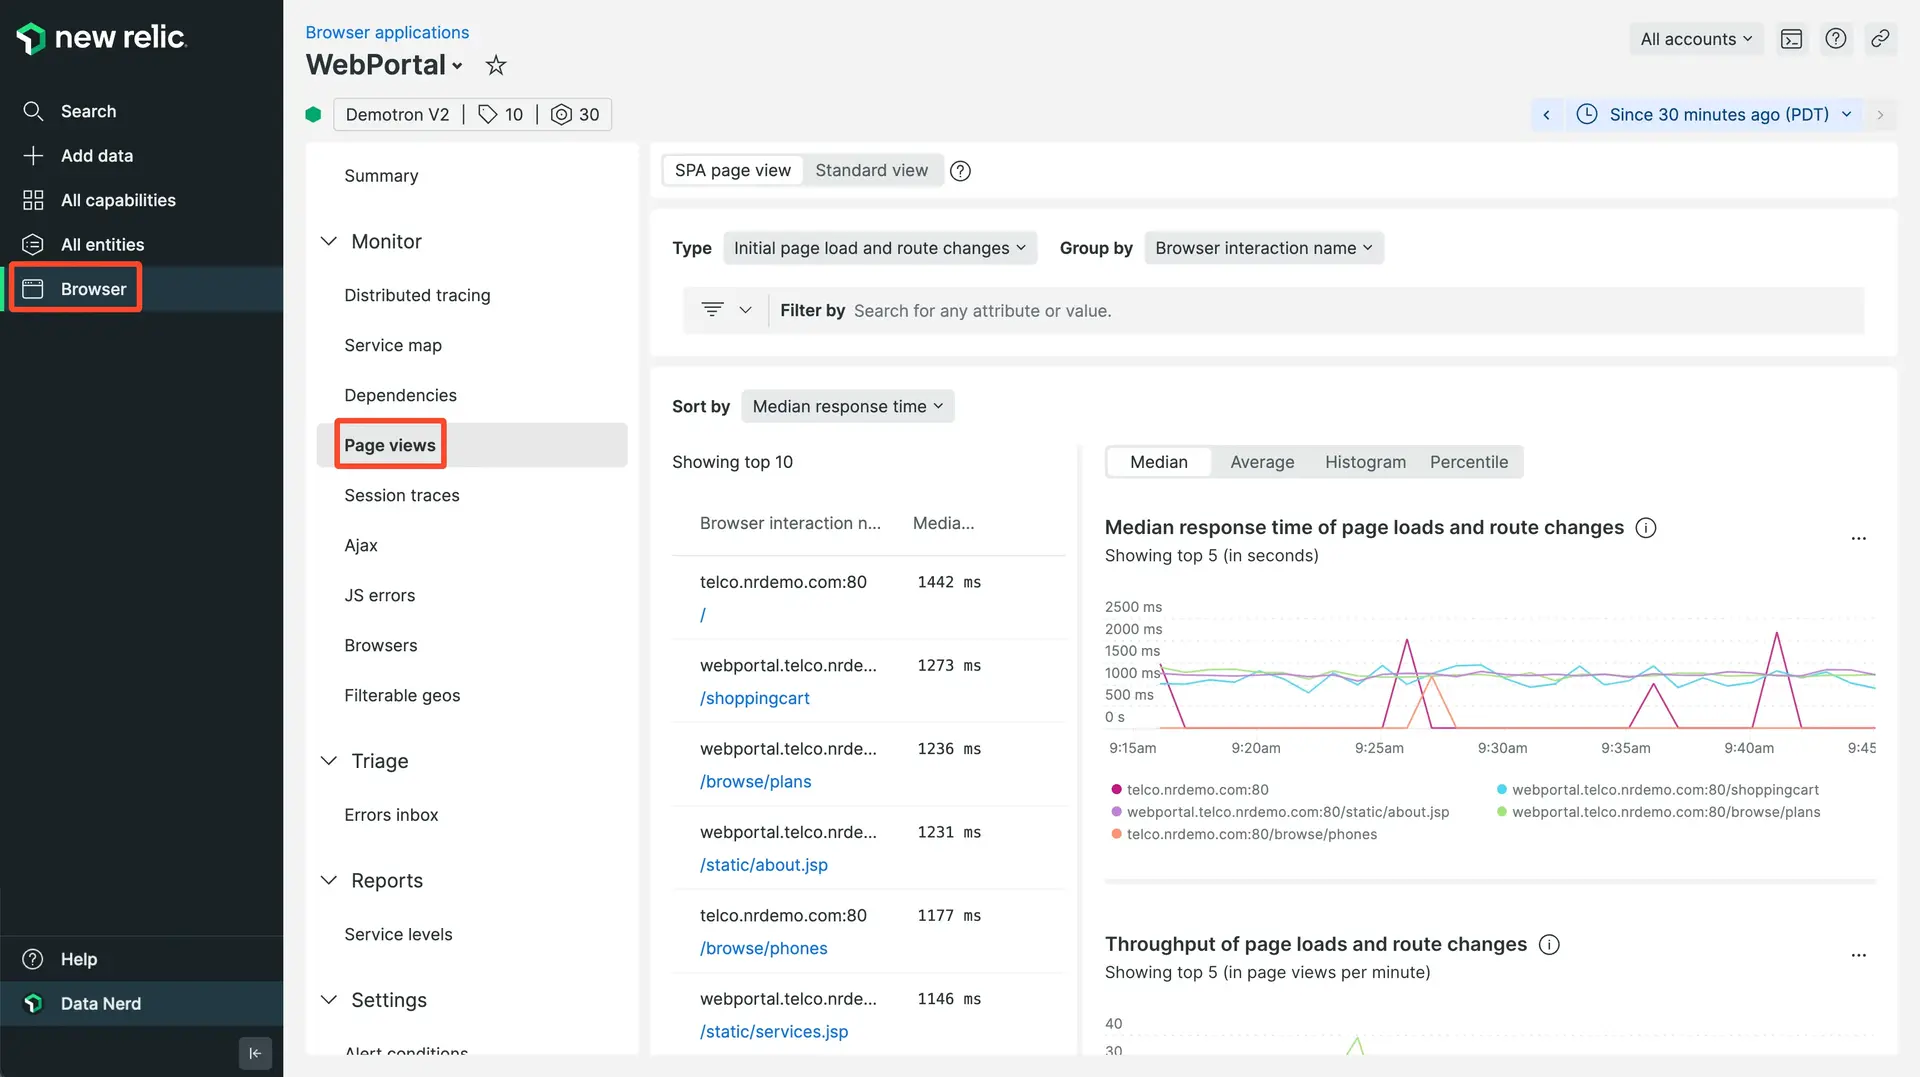
The Page views page in provides insight into the performance of your site's pages and user experience. Sort options help you find details about percentage of page load time, average page load time, or throughput. You can also view user frustration signals and performance impact metrics, access session replays, and explore detailed information about the top webpages viewed.
Our browser capabilities include single-page app (SPA) monitoring. If you have opted in to SPA monitoring, your SPA Page views UI will be different. You can toggle between which view (SPA or standard browser) you want.
View summary information
Browser monitoring lists page views as URLs. This makes it easy to identify specific frontend page views; for example, /browse/plans.

one.newrelic.com > All capabilities > Browser > (select an app) > Page views: This page provides detailed information about page load time, throughput, top transactions, and traces.
To view detailed information about which pages the end users are viewing for your app:
- Go to one.newrelic.com > All capabilities > Browser > (select an app) > Page views.
- Toggle the page view for SPA or standard browser apps as applicable.
- Select the type of view for page load timing information as a chart (default), histogram, or percentile.
Understand user impact metrics
The Page views page includes user impact pane that help you understand how performance issues affect your users' experience.
Frustration signals
The Frustration signals shows the percentage of user sessions containing frustration indicators in the selected time period. Frustration signals include:
- Rage clicks: Users rapidly clicking the same element 4 or more times within 1 second
- Dead clicks: Clicks that don't result in any detectable change within 2 seconds
- Error clicks: Clicks followed by a JavaScript error within 2 seconds
Performance risk
The Performance risk shows the percentage of user sessions affected by performance issues in the selected time period. It displays unhandled exceptions and application errors for JavaScript errors.
Session Replay sampling considerations
The user impact cards adapt based on your Session Replay configuration:
Examine performance details
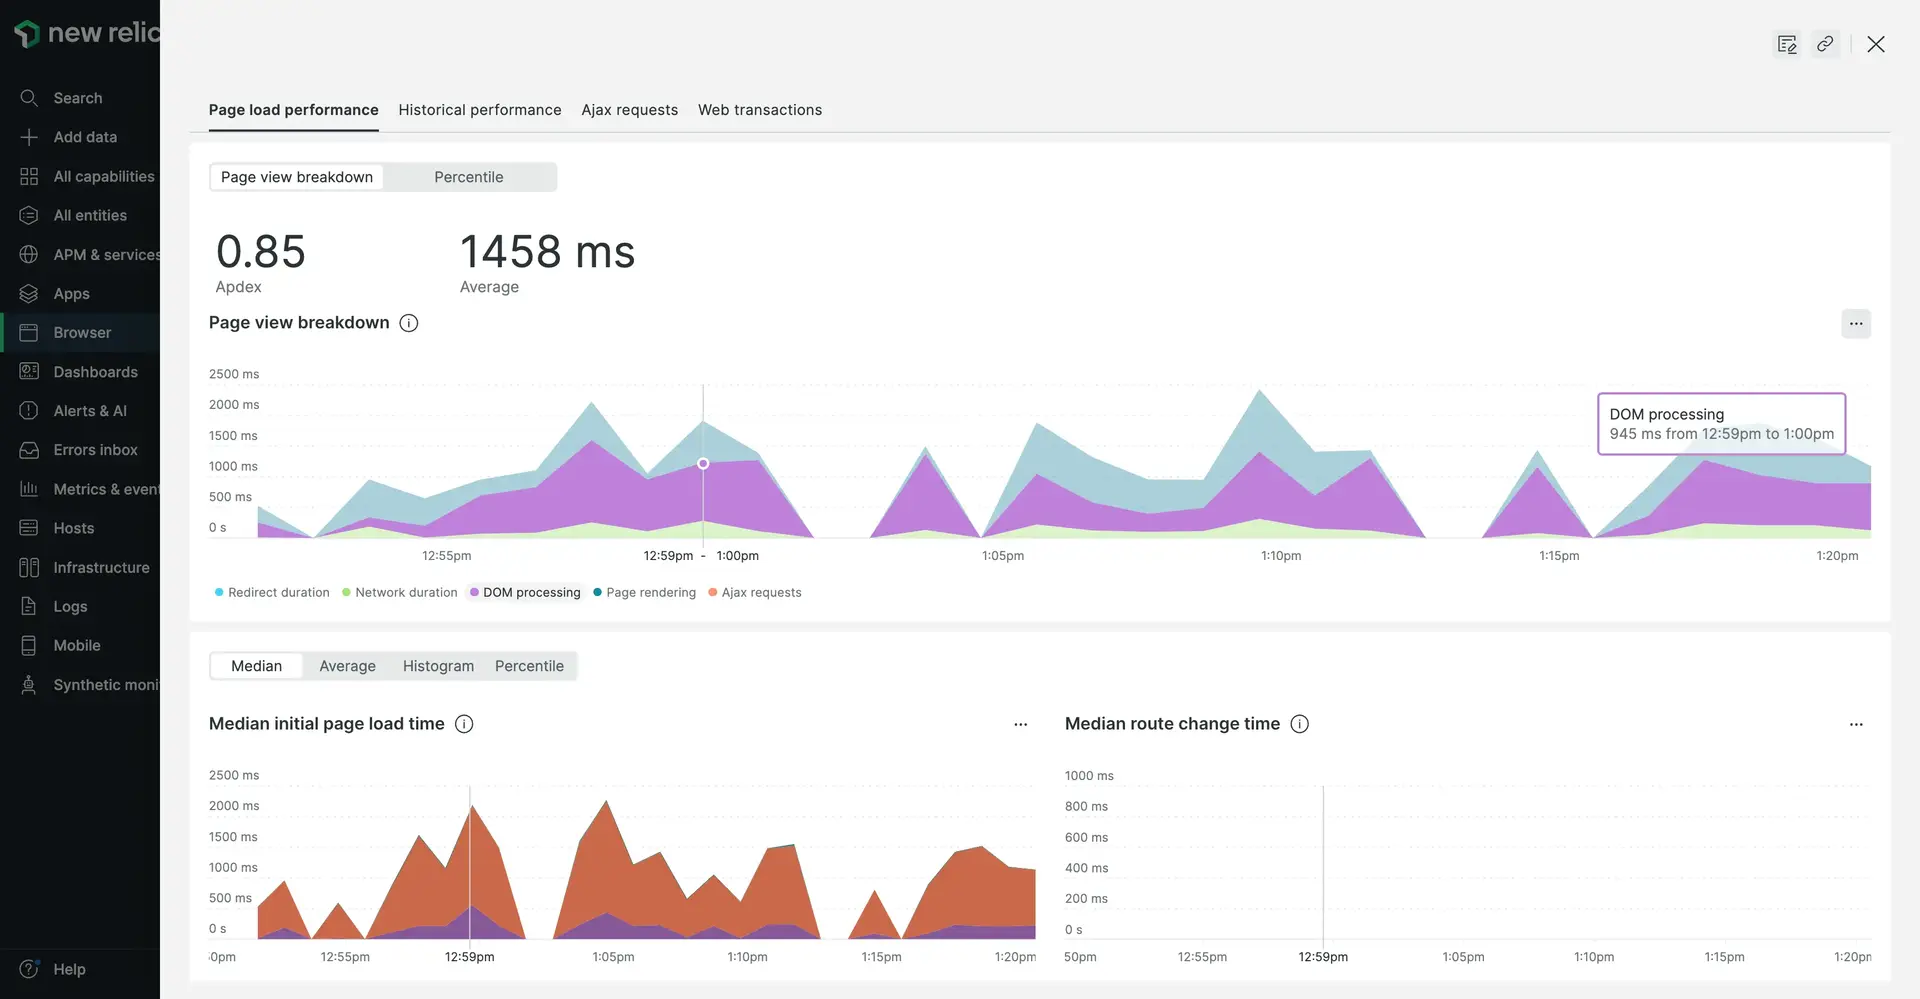
From the page view summary, click a URL to view performance details about page load, frontend and backend timing in APM or in distributed tracing, throughput, types of browsers, and session traces.

From here you can also:
- Compare page load and throughput performance with yesterday and last week.
- View response time for app response time for web transactions.
Examine timing details for page loads
The page load timing process shows colored-coded details:
Page load timing process | Description |
|---|---|
Request queuing | Wait time between the web server and the application code. Large numbers indicate a busy application server. |
Web application | Time spent in the application code. |
Network duration | The network latency, or the time it takes for a request to make a round trip over the internet. For apps that have been deployed using the copy/paste method, browser monitoring includes web app and queue time in network time. |
DOM processing | In the browser, parsing and interpreting the HTML. Measured by the browser's |
Page rendering | In the browser, the time to display the HTML, run the inline JavaScript, and load images. Measured by the browser's |