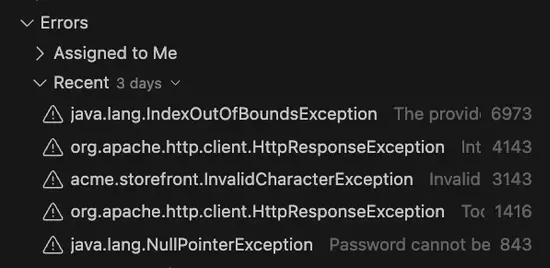
CodeStream shows you errors for any APM or browser monitoring service, including errors assigned to you and recent errors happening in the code opened in your IDE. You can control the timeframe via the dropdown list in the heading of this section. Note that this list may be a subset of the errors shown in the errors inbox on New Relic.

Just click on an error to dig into the root cause and collaborate with teammates on the investigation.
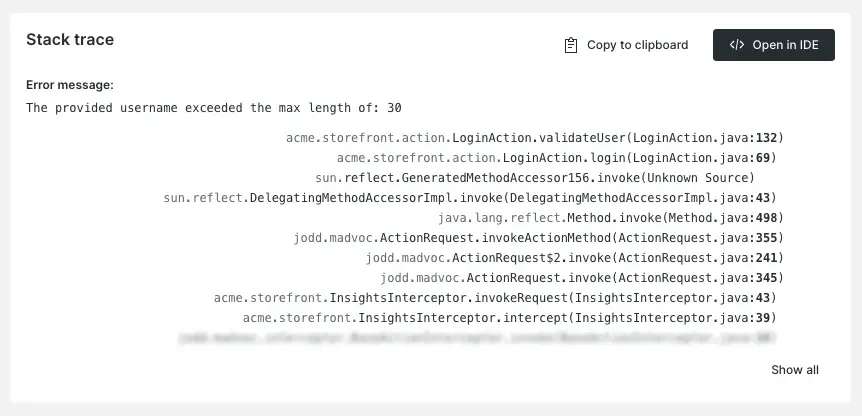
Click any frame in the stack trace to jump straight to the corresponding file and line number. If you're associating git references with your errors, CodeStream opens a read-only editor tab of the file that triggered the error in the environment. If you aren't associating git references, then a local version of the file opens instead. You won't be able to click stack trace frames that represent code not part of your repository (e.g., an external library).
For errors in browser monitoring services you'll need to upload sourcemaps so that the stack trace can be un-minified, allowing you to jump to the code for each frame.
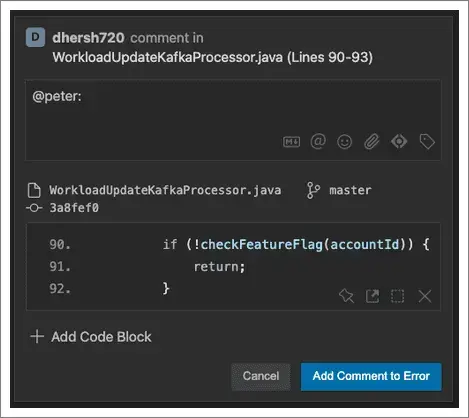
As you navigate the stack trace, you can find code that seems like the source of your problem and start a discussion with the comment button. CodeStream automatically mentions the most recent person to touch that code, making it easy for you to bring the right people into the discussion.

Once you've identified the problem you can assign the error, or update the error status from unresolved to resolved or ignored.
Starting from the errors inbox
You can jump into this same errors experience directly from an error in the errors inbox on New Relic. When viewing an error with a stack trace, click Open in IDE to go directly to the code in your IDE.

Also note that discussions are kept in sync between CodeStream and the errors inbox, so you can participate from either location.
Associate build SHAs or release tags with errors
When viewing an error in CodeStream, you may see a build SHA or release tag associated with the error if it doesn't have a git reference. CodeStream uses the git reference to match the specific stack trace error with the version of the code running in the environment that triggered the error. While you don't need a git reference configured to investigate the error, bear in mind that you may not be looking at the version of the code that caused it.

You can use an environment variable to let the New Relic agent know the commit sha associated with each build of your project. You can also use the release tag associated with the running version of your software.
For APM, the commit sha and/or release tag (tags.commit and tags.releaseTag) are added as attributes on Transaction and TransactionError events. You can use APM environment variables to set these attributes. We recommend setting one or both of these variables as part of your build pipeline:
NEW_RELIC_METADATA_COMMIT: The commit sha. You can include the whole thing or only the first seven characters (e.g.,734713b).NEW_RELIC_METADATA_RELEASE_TAG: A release tag (such asv0.1.209orrelease-209). This has the advantage of being human readable.
For more on how to set these variables, here are specific configuration details for each language:
If you do have git references configured, CodeStream will let you know if the version of the code you're on locally doesn't contain the reference associated with the error. In this case, you may want to check out the version of the code that does contain that reference so that you can more effectively investigate and resolve the error.

CodeStream will also let you know if the error doesn't have a stack trace associated with it. This happens with older errors when the stack trace has aged out on New Relic.