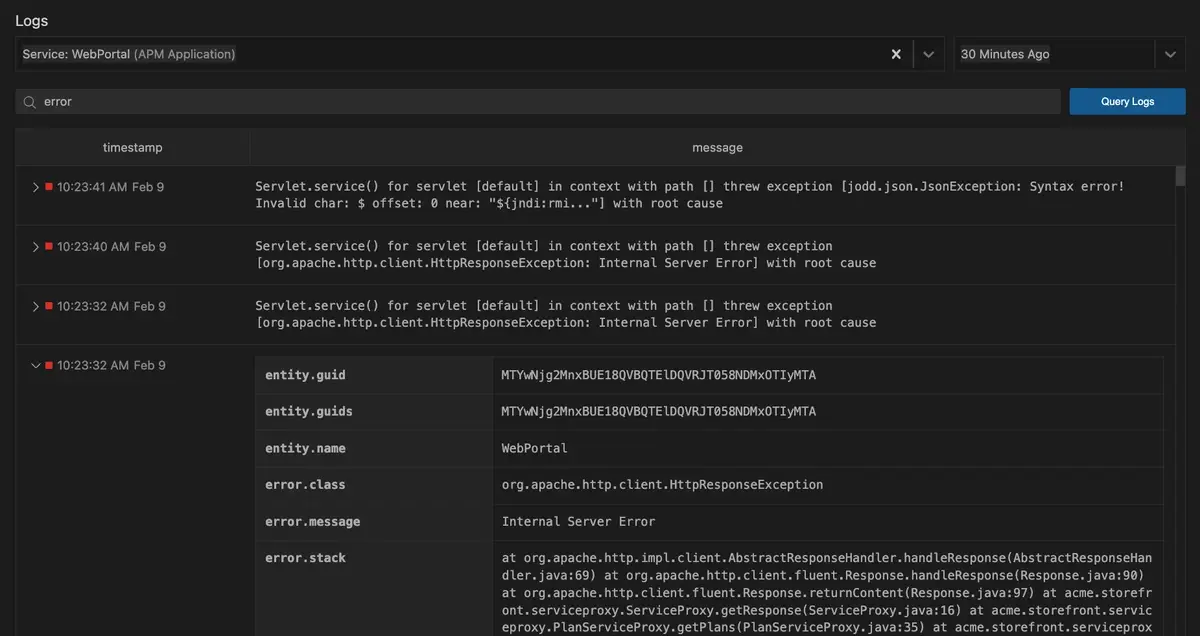
No need to slow down your investigation by context switching between your IDE and your browser to search logs. CodeStream brings the New Relic log-search experience right into your IDE! Click on the View Logs entry for any service listed in the CodeStream pane, or click on the View Logs icon in CodeStream's global navigation.
The dropdown list at the top of the page reflects the currently selected service in the CodeStream pane's tree view. However, you're free to choose any service or entity to view its logs.
If the chosen entity has partitions, you can further refine your search by selecting specific partitions from the dropdown.

Expand log entries for detailed information by clicking the caret next to them. Hover over any value to copy it.
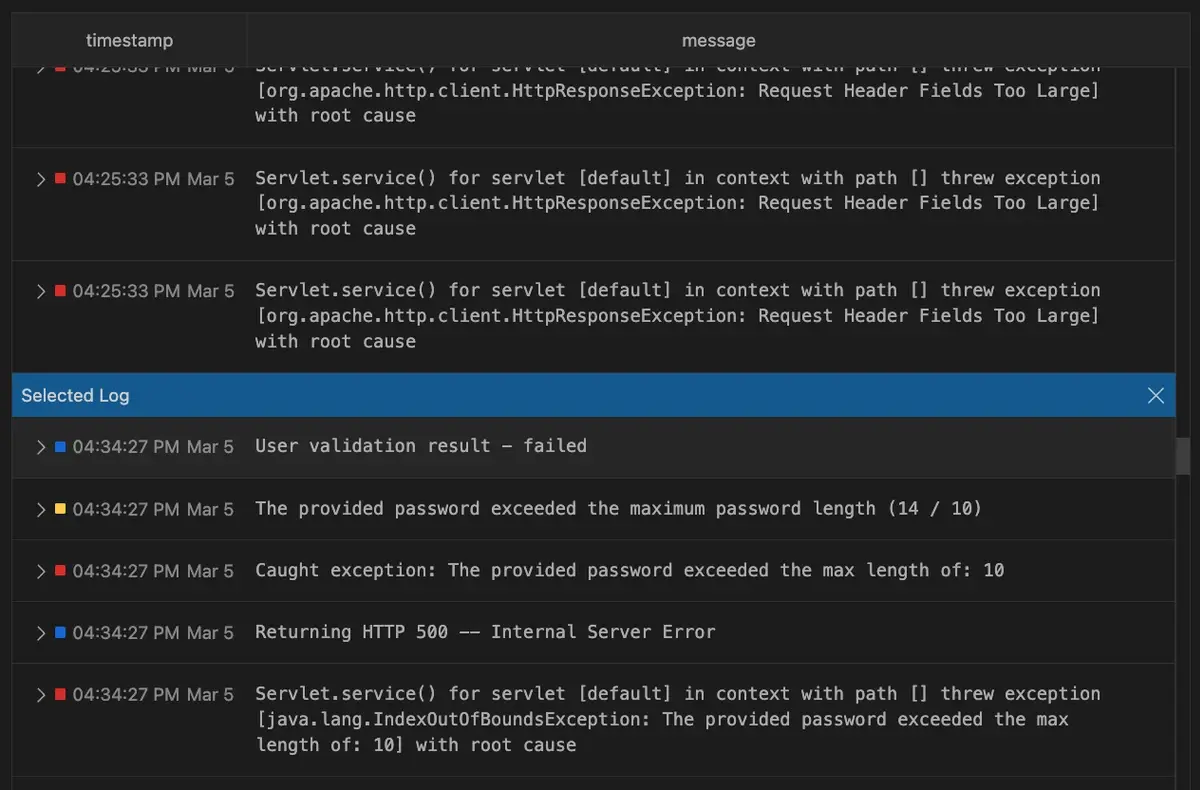
If you've narrowed down your results using a keyword search (e.g., for an error message) and now want to see a specific result in context, hover over the entry and click on the Show Surrounding Logs button that appears at the right. This will pin that specific result and then show the log entries that preceeded and followed it in the log file.

Search for specific log lines
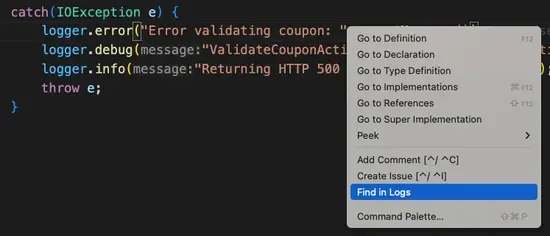
You can also jump into a log search right from any log line in your code. You can select a string to search for and the select Find in logs from the context menu. You can also just select Find in logs without first selecting any text, and CodeStream will automatically extract the string from the line where the cursor is placed.
