Network request errors that occur because of either server issues or network failures can slow down your mobile app and negatively impact the user experience. Use the request errors page to understand what's causing HTTP errors and share actionable data with your team to solve the underlying issues.
View the request errors page
To view the request errors page, go to one.newrelic.com > All capabilities > Mobile > (select an app) > Request errors.

Recommended workflow
We recommend the following approach to investigate HTTP request errors and network failures, allowing you to gain a complete understanding of the error, identify contributing factors, and implement effective debugging strategies:
Drill down into a single error: To view details about a request error or network failure, click on the row from the error group table. Here you can view the request information, request attributes, and response body as well as get more information about that error.
Query and share error data: To explore the data behind any of the charts or lists on the HTTP errors page:
- On any chart, click the … menu, and then click View query.
- From the query builder, you can add the error data to a dashboard and share it via a permalink.
To dig deeper into the error data, query your data for the following events and attributes:
MobileRequestErrorevents and attributesMobileRequestevents and attributes
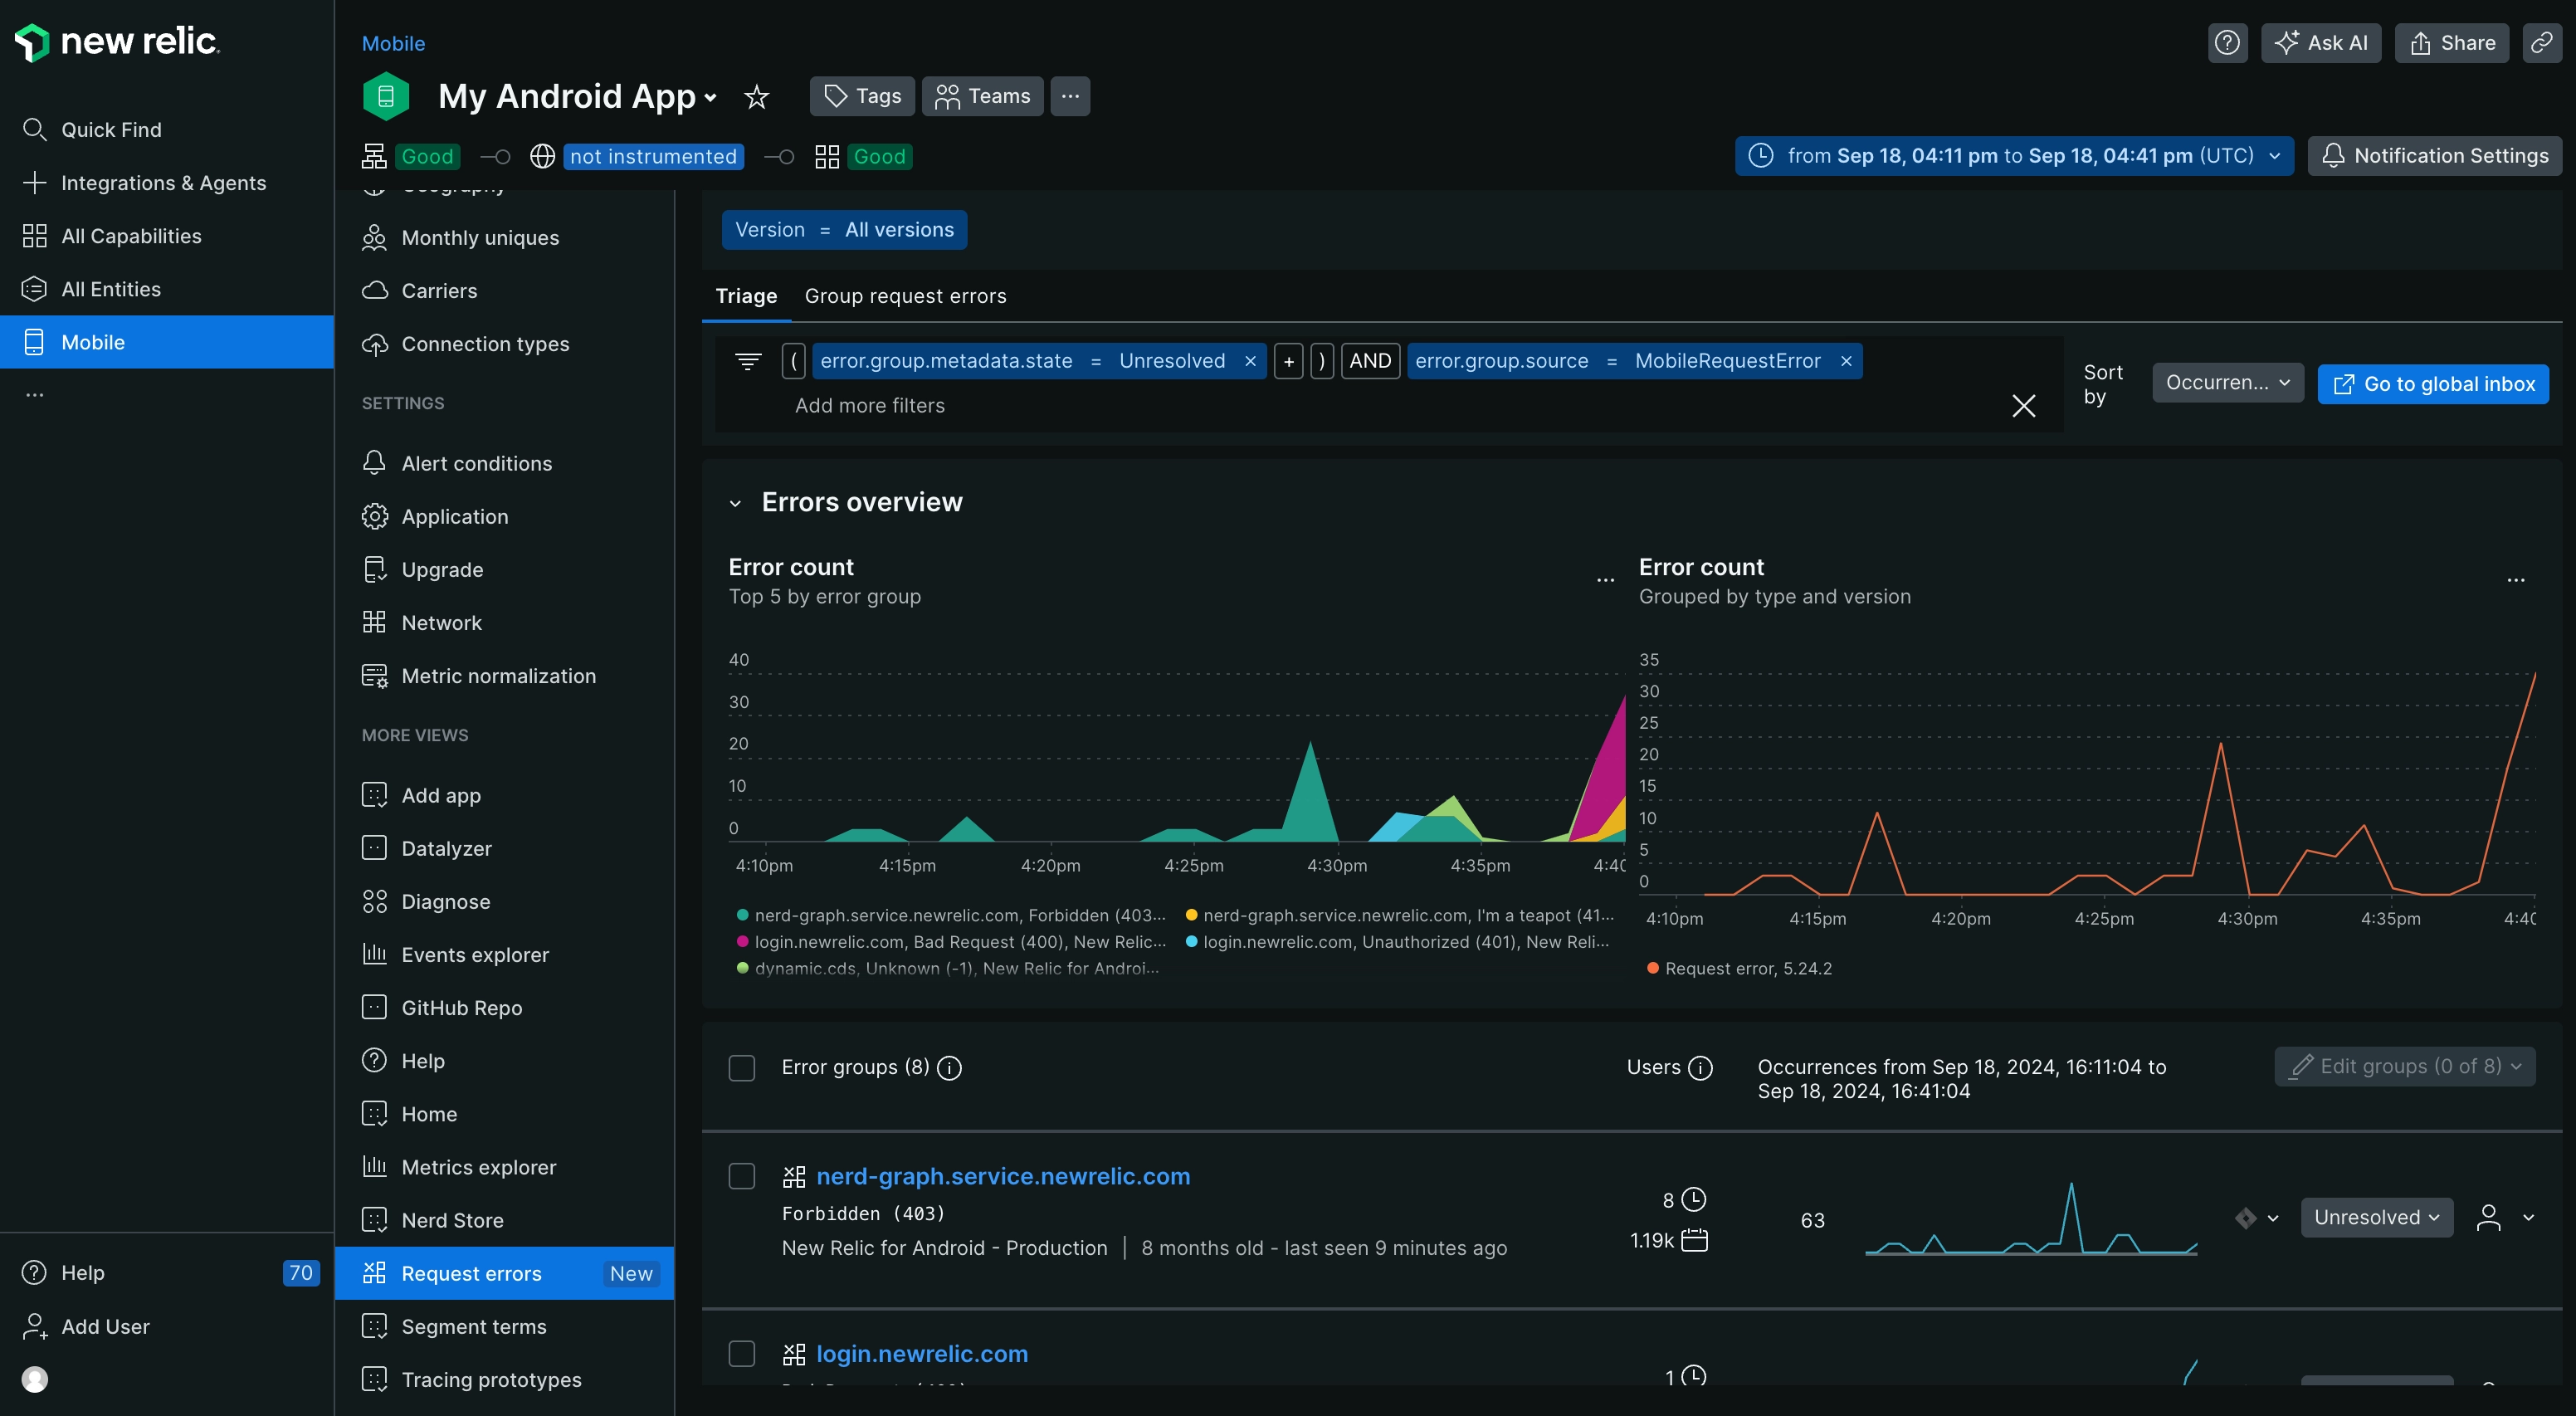
Change how the page groups and sorts errors and network failures: Make selections using both the attributes and filter bars at the top of the page. By default, the errors are grouped by request domain and request path.
Filter for specific errors and network failures: Select an error or failure using multiple filters from the filter bar.
See which filters you applied or remove filters: The filters you select display in the filter bar. To clear filters, select the X next to the filter you want to clear.
Change the time window: Select a new time period from the time picker dropdown.
View information for one specific app version: Select the version that you want to see charts and lists for in the versions dropdown. By default, all available versions are shown.
The sections below describe what you can do on the request errors page.
Triage tab
The triage tab shows an overview of unresolved errors and how they correlate with the error rate. The error group table lists groups of errors by occurrence and allows you to asssign them to users who can investigate and fix them.
Group request errors tab
On the group errors tab you can:
Assess overall HTTP and network request error trends: See an overview of request errors and error rates across multiple request domains and mobile app types and versions. Use this data to quickly identify and fix your API requests.
Filter for deeper analysis: Use groups and filters to focus on specific request attributes, such as the request type, request path, error type, or any custom attributes you've defined.
Identify patterns: Examine the request error table for trends related to request domains, request paths, and frequency of occurrence.
Investigate individual request errors: Select a request error report to view its distributed trace, event trail, response body, attributes, and other relevant details necessary for effective debugging.
Update error status: Mark the request error as Resolved or assign it to a specific team member who can own and examine the issue, and then deploy a fix.
Request error details
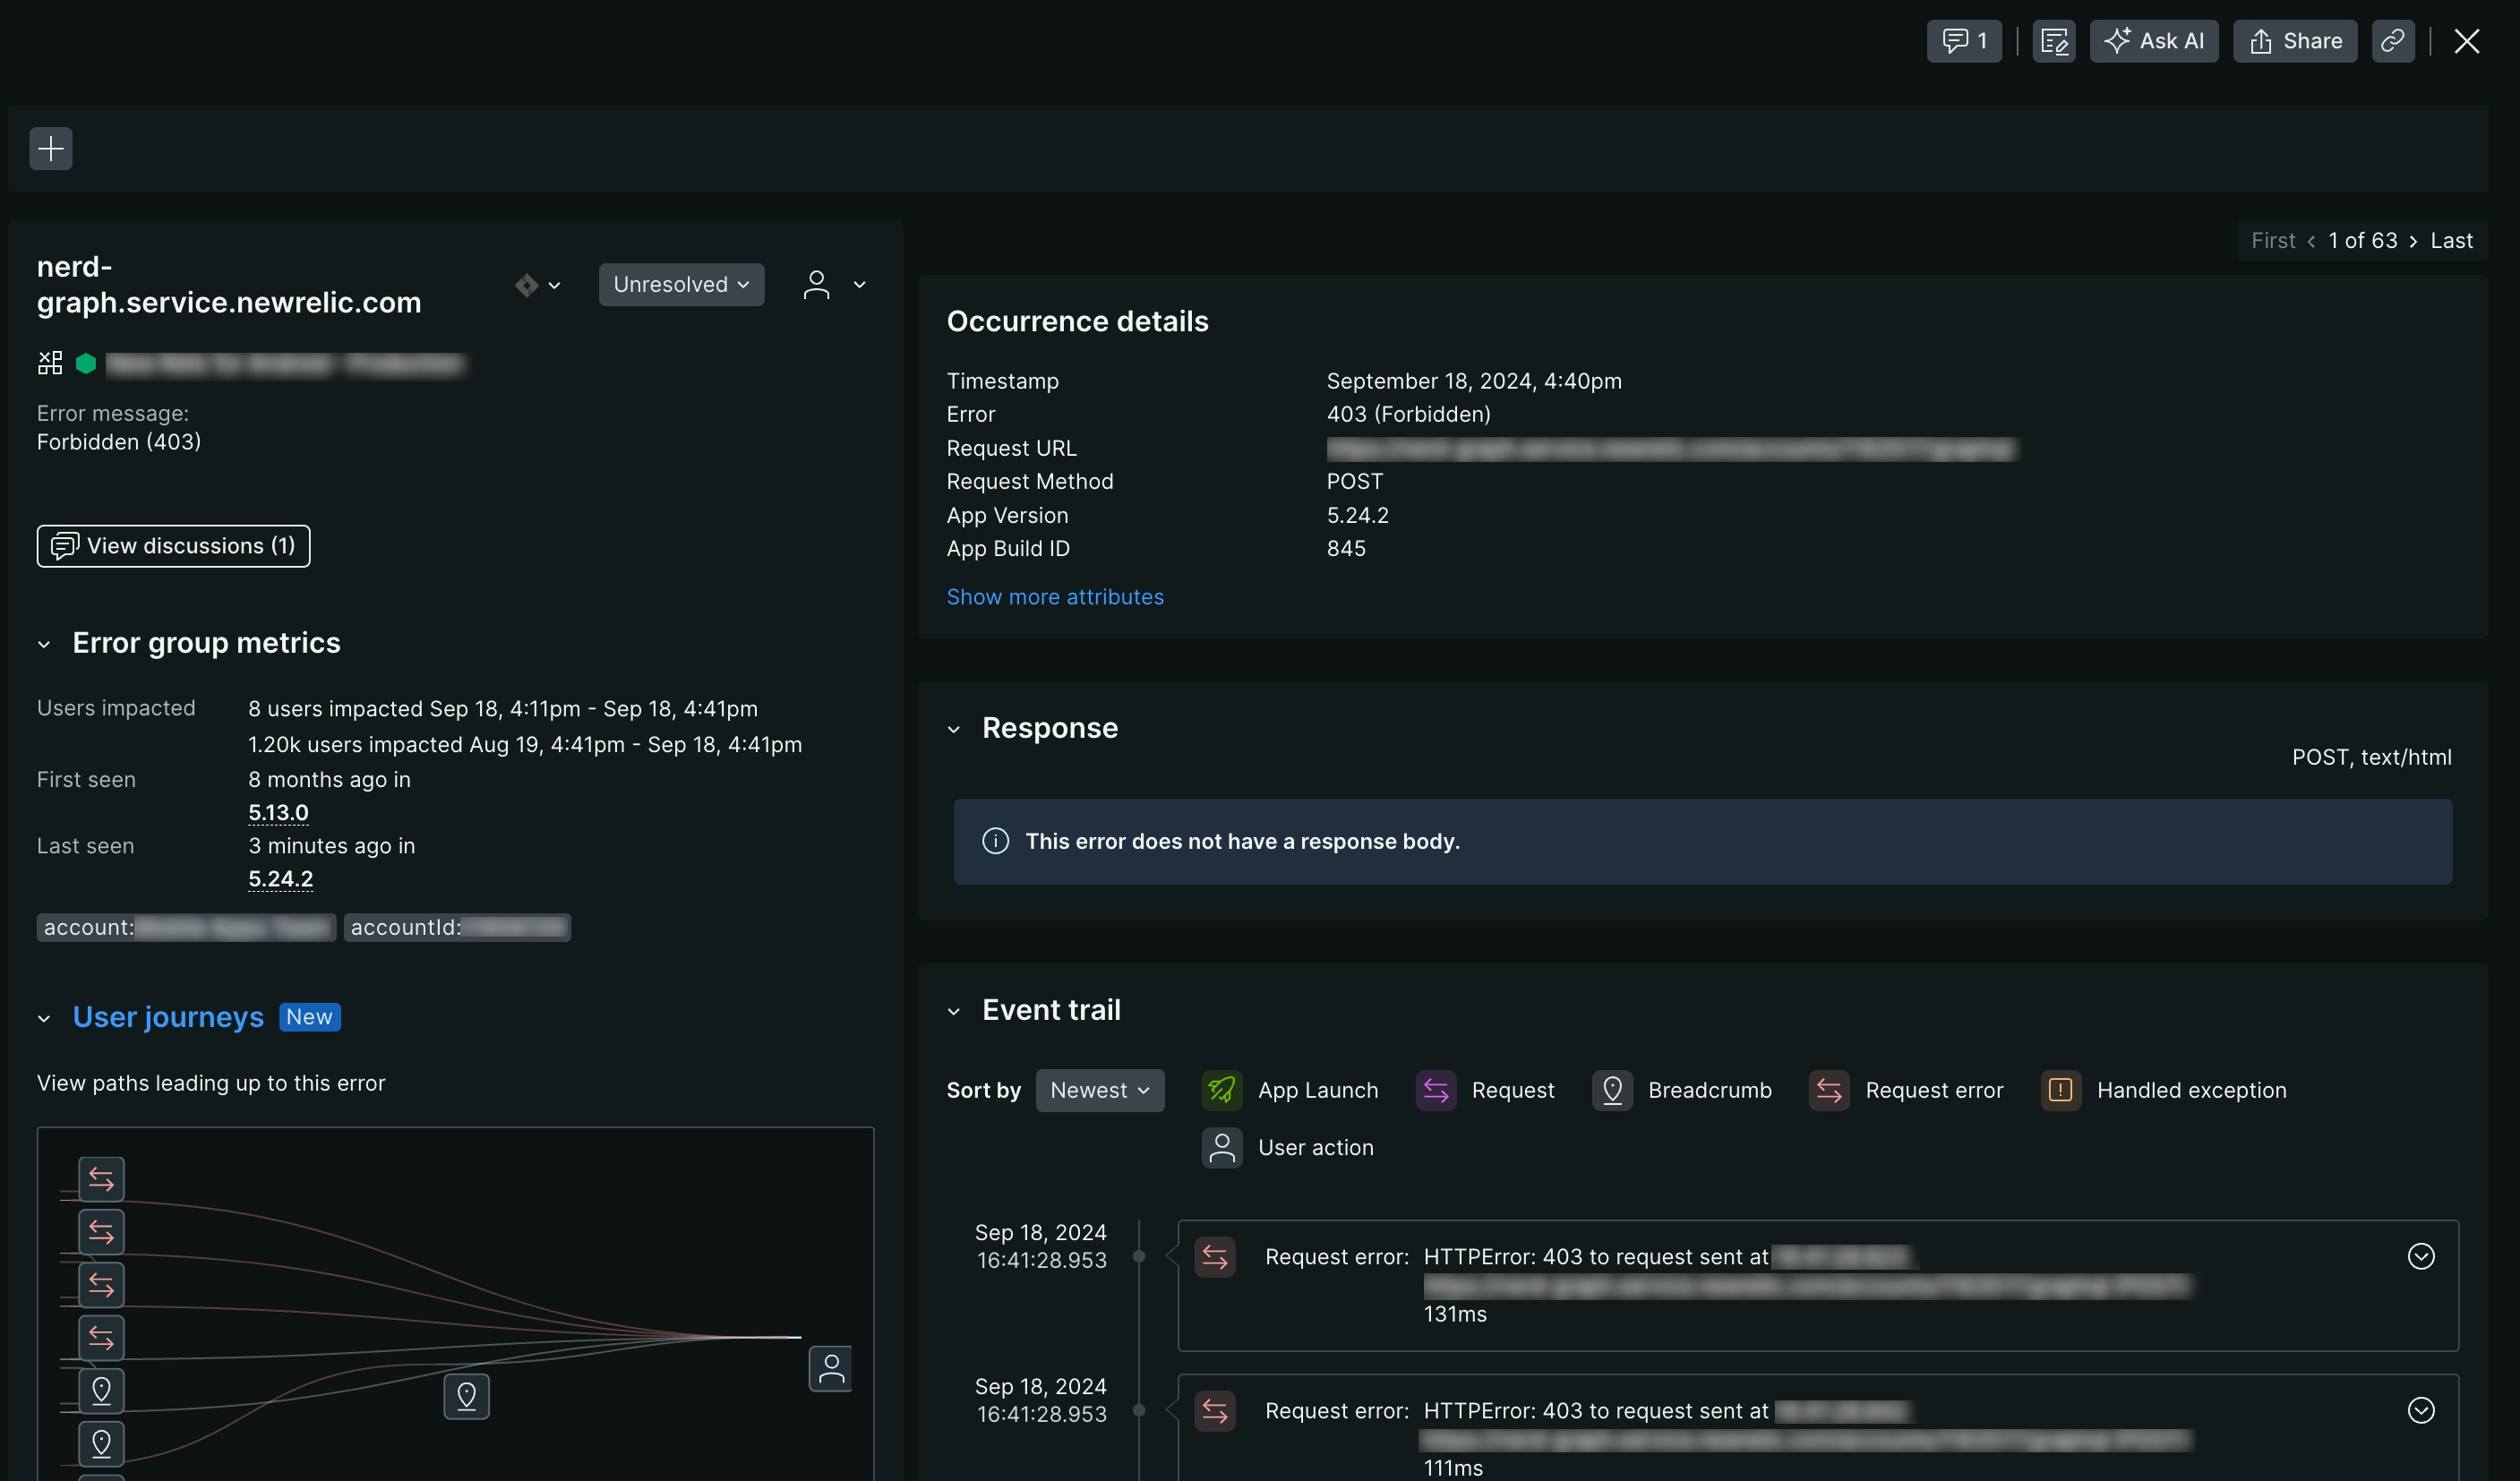
On the request errors page, click into a specific error to see:
- User journeys: Displays the different paths and actions a user performed that led to the error.
- All occurrences chart: Displays the frequency of a request error over the selected period, starting from its initial detection. You can view either the aggregated data of all occurrences or a breakdown by app version.
- Error type breakdown: Displays the distribution of this request errors across different operating system versions or affected devices.
Resolved errors include a banner containing details on the user who resolved the request error and the resolution timestamp. Note that mobile monitoring data retention policies apply, allowing you to filter by resolved errors for historical analysis when needed.

one.newrelic.com > All capabilities > Mobile > Request errors: Select a request error to open the request errors details page.
Profiles
When you look at a specific error,, the profiles section provides visual details about significant differences in the frequency of different values for HTTP error events. For each attribute, the error profile includes:
- A heatmap showing how the error's attribute is distributed for values that deviate the most
- A label comparing the error attribute's distribution to that of other errors

one.newrelic.com > All capabilities > Mobile > Request errors > (Select a specific error): Select a request error to open the request errors details page and view the error profiles.
Triage
When you look at a specific error, the triage section associates the specific error occurrence you are viewing with its system-created error group. These system-created error groups are identified by a unique fingerprint. It is this unique fingerprint that allows you to triage error groups by status updates or assignments.
For more info on how error groups are created, see How error groups work, and to learn more about status and assignments, see Error tracking.

one.newrelic.com > All capabilities > Mobile > Request errors > (Select a request error): From the request errors details page you can triage specific error occurrences by adding status updates or assignments.
Distributed trace
When you look at a specific error, the distributed trace section tracks and observes your requests as they flow through your application, traversing various services to reach completion. By visualizing the entire request path across different services, you can rapidly identify failures or performance bottlenecks.
To learn more about how distributed tracing works, see Track requests across your microservices.

one.newrelic.com > All capabilities > Mobile > Request errors > (Select a request error): From the request errors details page you view the distributed trace associated with that request.
Response
A typical response to a request comprises a response header and response body, which together convey information about the success or failure of the request. The response header contains metadata about the server, while the response body holds information about the output, including a success or failure code and corresponding message.
We capture the response body for requests whenever available, displaying it on the request errors details page to expedite debugging.

one.newrelic.com > All capabilities > Mobile > Request errors > (Select a request error): From the request errors details page you view the response body associated with that request.
Event trail
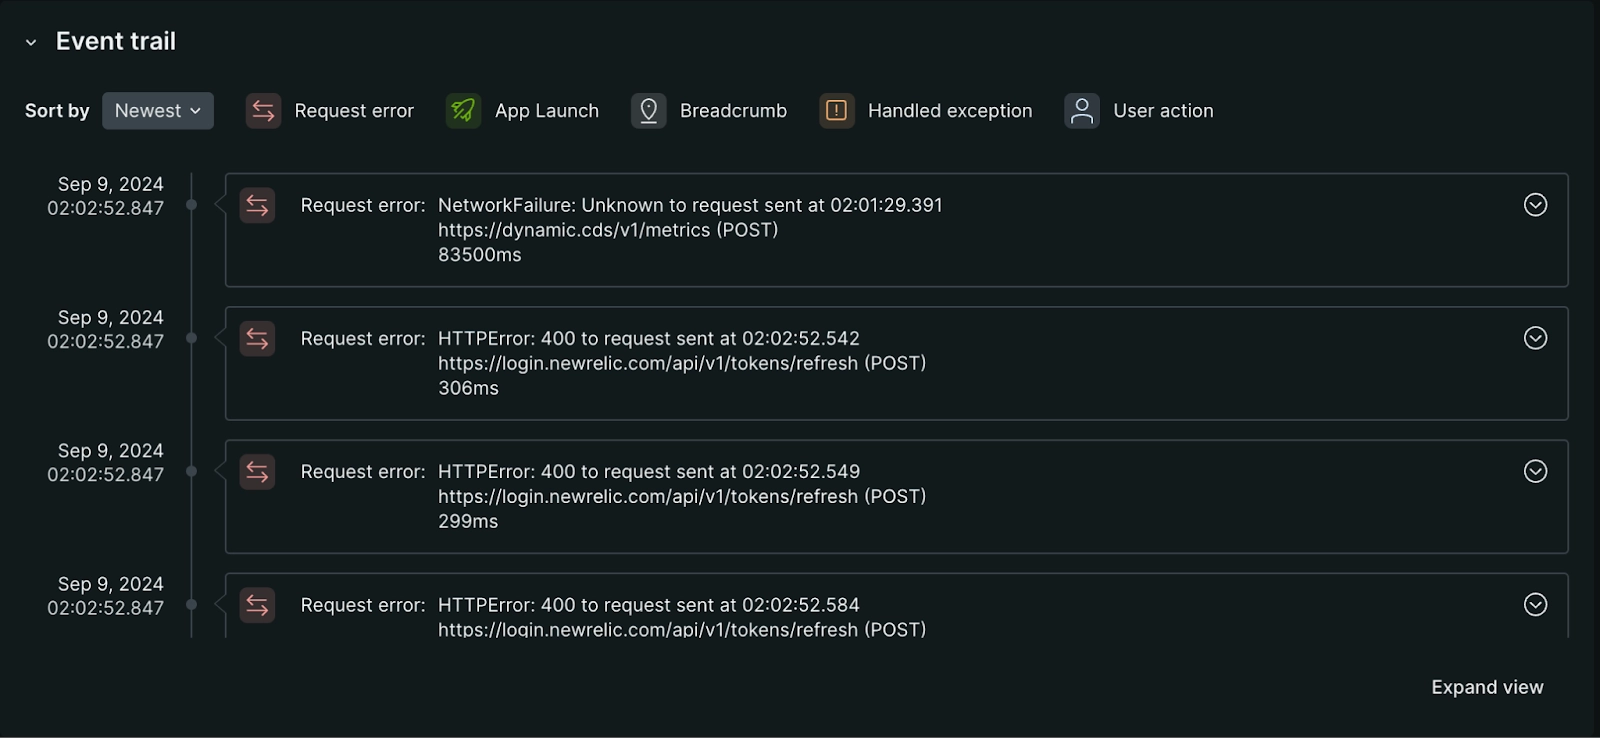
When you look at a specific error, the event trail provides a chronological log of all events leading up to the request error, which helps with root cause analysis. These can be events New Relic monitors by default, or custom events. The event trail is sorted chronologically, beginning with the oldest event, which is typically the app launch, but you can modify the following:
- Sort: Toggle between ascending and descending order
- Event filtering: Filter by event type, like
app launch,request,request error, oruser actions. - Event details: Expand individual events to inspect their attributes, like
errorType,responseTime, orrequestUrlfor request events.
After you've sorted and filtered your events, you can dig a little deeper into the events that lead up to the error by examining:
- Custom breadcrumbs: Utilize the Record breadcrumb SDK to create custom
MobileBreadcrumbevents. This allows you to log specific application interactions that may be relevant to investigating your error. - Handled exceptions: Use the Record Handled Exception SDK methods for iOS and Android to annotate where exceptions are handled in your application. These annotations will automatically populate the crash event trail.
For guidance on enhancing crash event trails with custom data, see Record breadcrumbs.
To fully leverage our crash analysis tools, make sure to:
- Use the mobile SDK to create custom
MobileBreadcrumborMobileHandledExceptionevents. - Enable
MobileRequestevents for capturing network request data.

one.newrelic.com > All capabilities > Mobile > Request errors > (Select a request error): From the request errors details page you can dig deeper into the events that led up to a specific error using our event trail.
Attributes
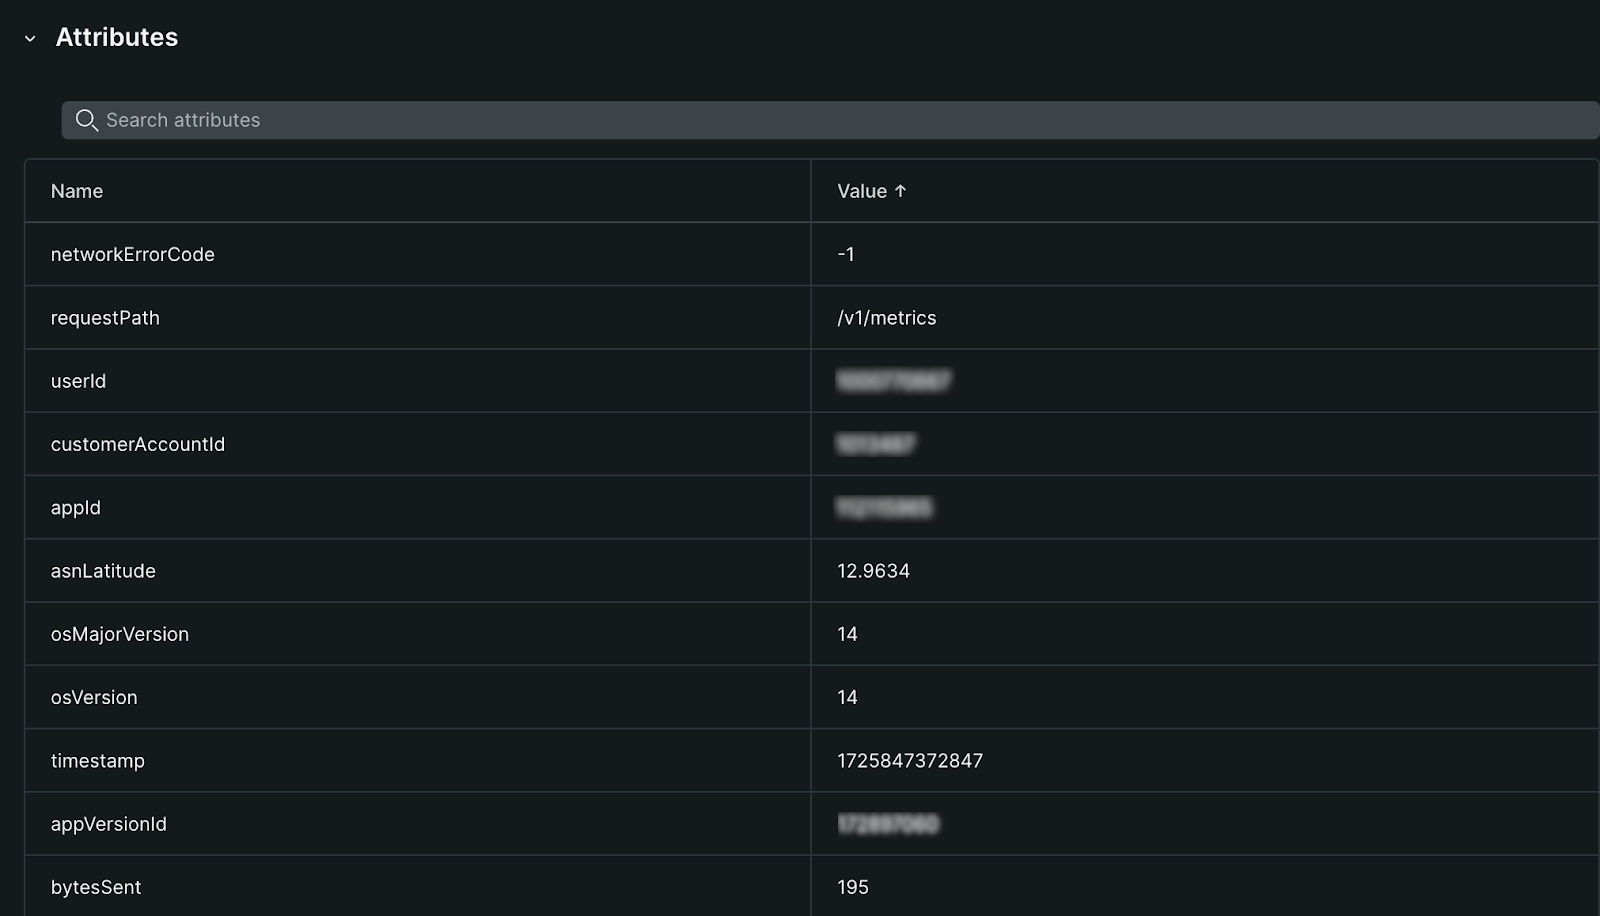
When you look at a specific error, each request error sample includes a comprehensive set of attributes that provide detailed information about the request, response, and the specific parameters that triggered the error. These attributes offer valuable insights into the error's context and help in understanding the root cause.

one.newrelic.com > All capabilities > Mobile > Request errors > (Select a request error): In the attributes section, you can dig deeper into the attributes collected for that request.
Troubleshooting
- Keep in mind that profiles are disabled when there are no profiles available that match the applied filters.
- Distributed trace for requests will most likely contain only one occurrence as it's a single HTTP event that's recorded in our system.
- Network failures do not have response body.
- The mobile agents maintain a list of exception types. In some cases, custom exceptions thrown by applications fall outside of this list. When this happens,
Unknownmay appear in the mobile errors inbox page. If you findUnknownin your list of errors and need assistance in researching which exception types are being missed, get support at support.newrelic.com.