Imagine you have multiple AWS services and want to monitor these services using New Relic. To do this, you need to establish a connection between your services and the New Relic platform. New Relic facilitates this connection through infrastructure agents combined with a variety of on-host integrations, as well as cloud integrations.
In cloud environments, where resources are highly dynamic, and serverless architectures are prevalent, New Relic's cloud integrations play a crucial role. These integrations offer agentless monitoring by directly interfacing with AWS APIs, making it simple to collect metrics and logs from services where traditional agents cannot be installed, such as AWS Lambda, DynamoDB, or Amazon S3. There's no installation process. You can simply connect your New Relic account to your AWS account with required configurations using guided instructions, and collect AWS data.
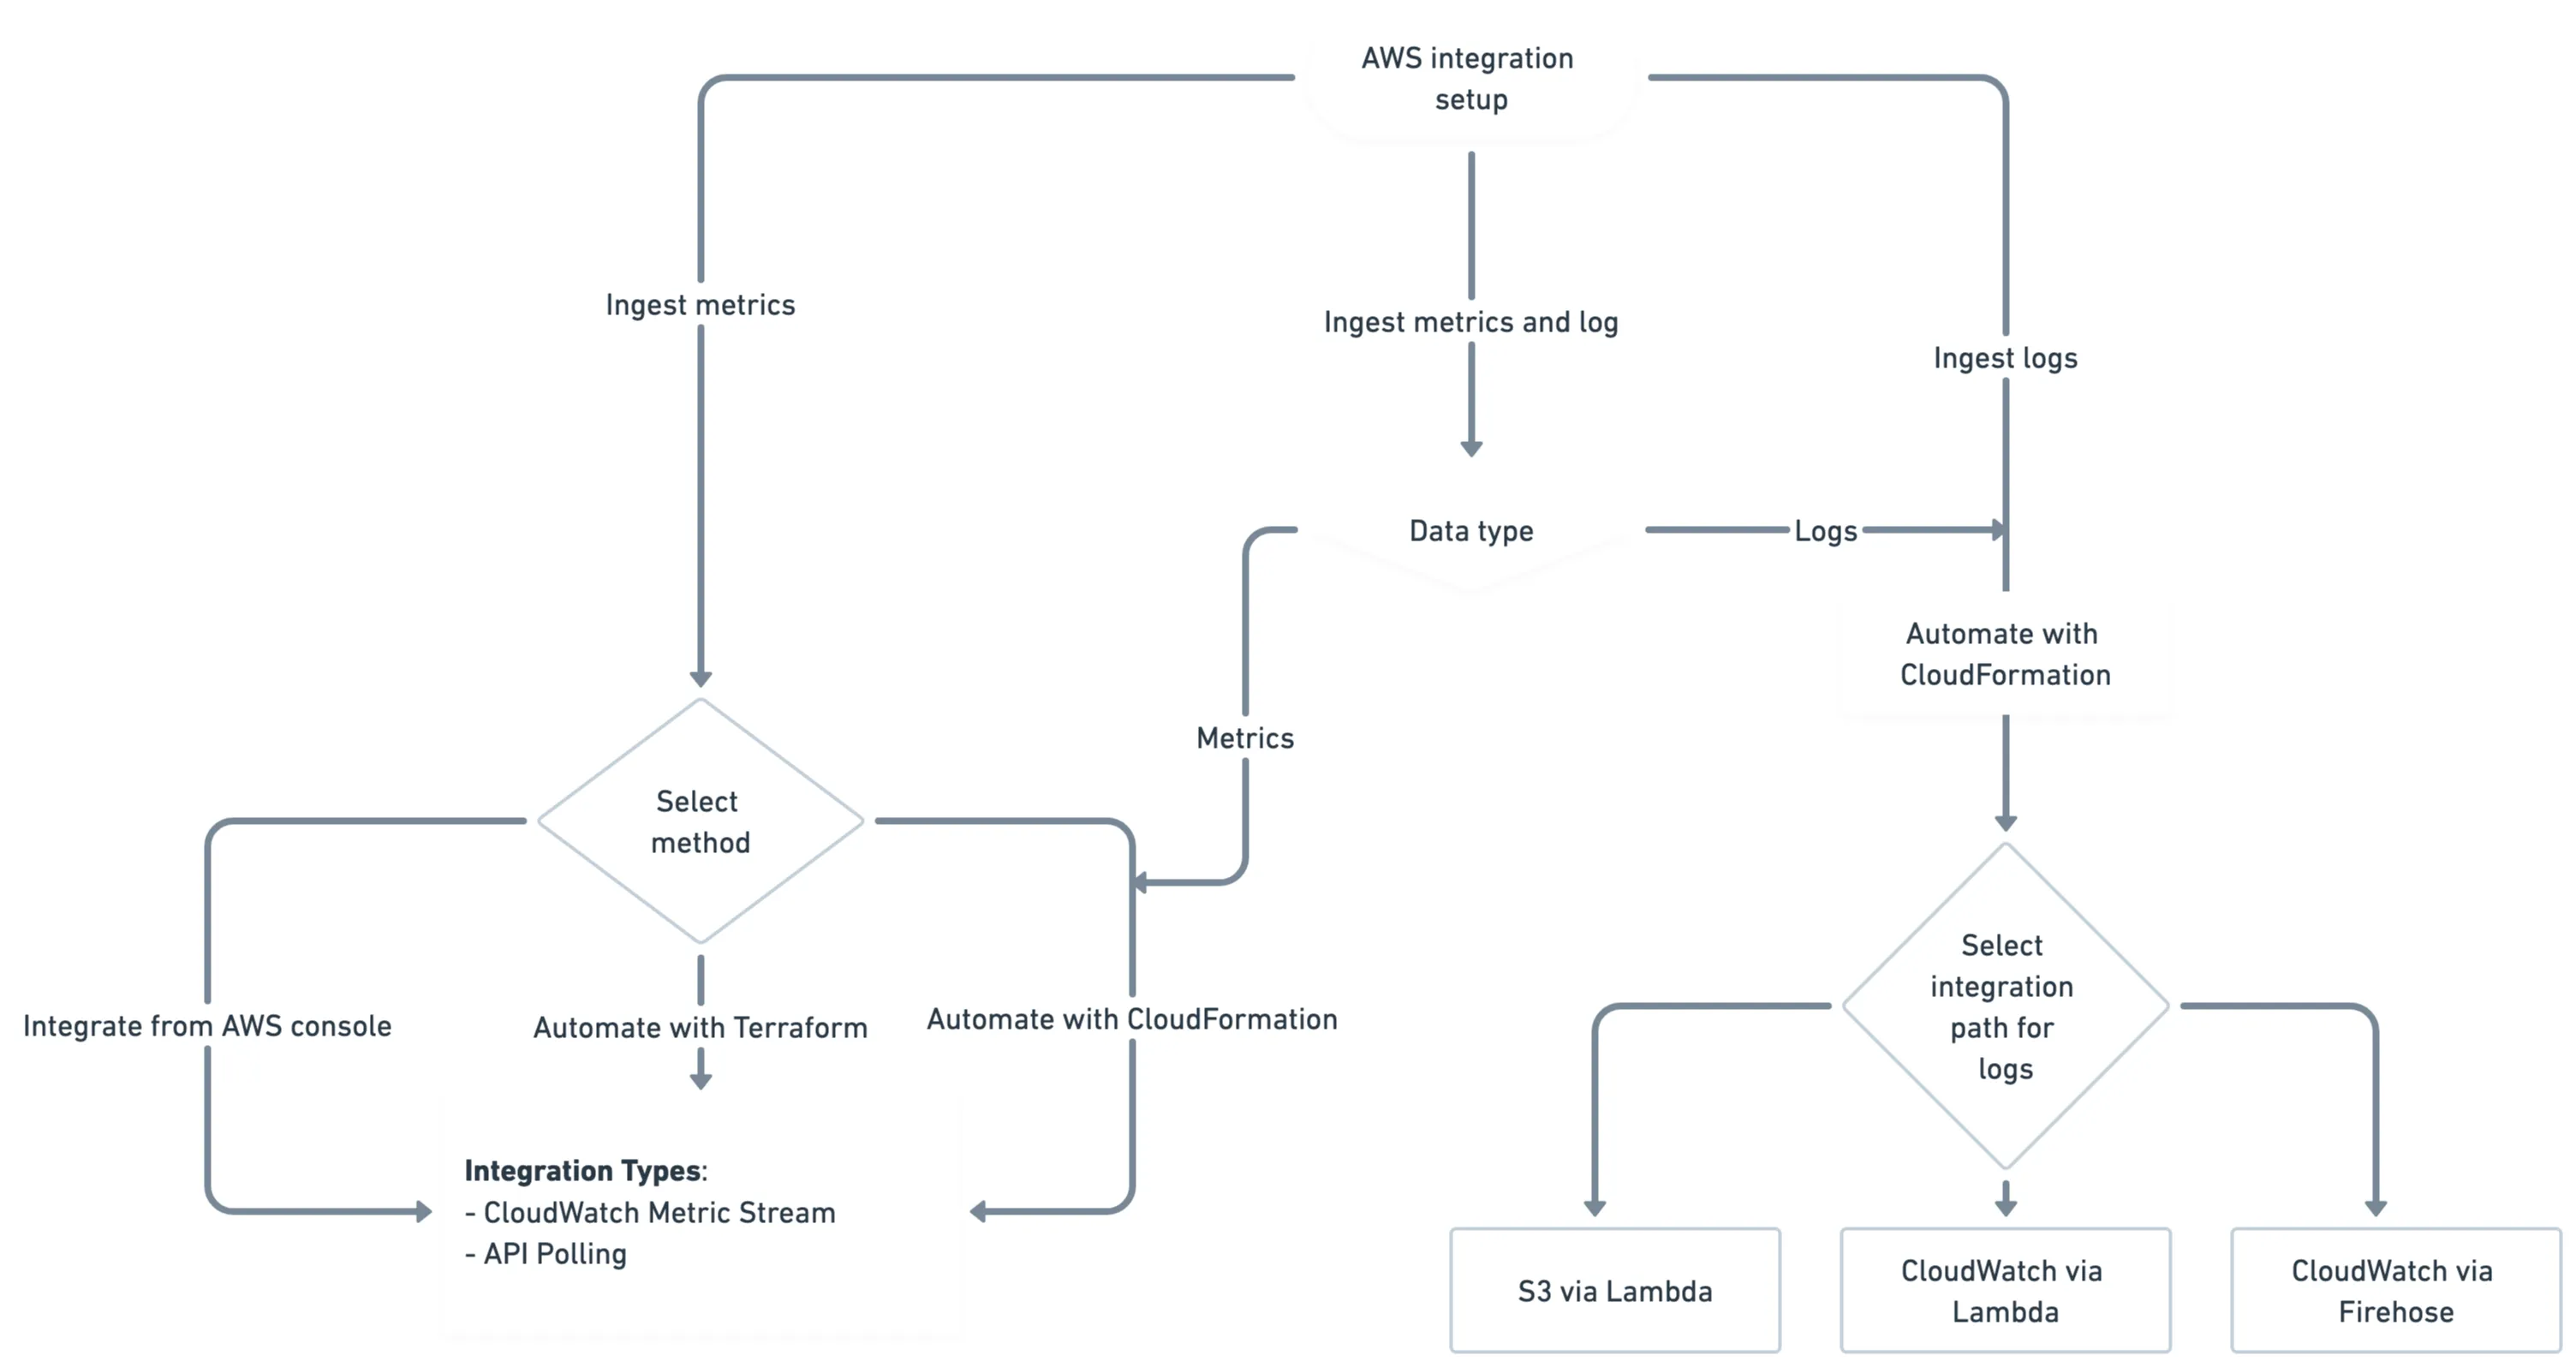
To understand the possible integration methods and types New Relic has, refer to the following diagram.

This diagram illustrates in how many ways you can integrate your AWS services with New Relics to get logs and/or metrics.
ヒント
Most AWS services offer regional endpoints to reduce data latency between cloud resources and applications. New Relic can obtain monitoring data from services and endpoints that are located from all AWS regions except China.
AWS metrics ingestion
To connect your AWS account with New Relic for metric ingestion, following are the three different methods available:
- Automate with CloudFormation: CloudFormation is an AWS service that allows you to model and automate your integration setup using declarative templates. This method is recommended for connecting your AWS account to New Relic, as it reduces manual configuration errors. You can completely design the integration on the New Relic UI and deploy it on the AWS console.
- Automate with Terraform: Terraform is an Infrastructure as Code (IaC) tool that allows you to manage infrastructure using configuration files instead of a graphical user interface. If you already use Terraform to manage your AWS accounts and services, New Relic provides an AWS Cloud Integrations module that simplifies setting up the AWS integration.
- Manual integration from the AWS console: This method is suitable for customers who cannot use CloudFormation templates and do not prefer to use Terraform. You can follow the instructions from the New Relic UI and do the configuration in the AWS console.
For any of the connection methods you choose, you have the following two integration types to receive metrics from your AWS services:
- Amazon CloudWatch Metric Streams integration: Amazon CloudWatch Metric Streams is an AWS service that allows you to stream metrics from AWS services to partner solutions such as New Relic. It supports all namespaces and can stream near-real-time data from your entire AWS stack.
- API Polling: API polling is a technique used to retrieve data from AWS services by making regular, scheduled API calls to gather metrics and metadata in intervals. It is a legacy solution and makes separate calls to each service.
While you can choose any of these two integration types, New Relic recommends choosing Amazon CloudWatch Metric Streams integration. Refer the following comparison between the integration types.
Feature | CloudWatch Metric Streams integration | API Polling |
|---|---|---|
Data delivery | Near real-time data streaming | Periodic data retrieval |
Data coverage | Continuous and comprehensive | Specifies individual metrics, potentially missing data |
Detection of short-lived events | Immediate detection | Potential delays in capturing short-lived events |
Latency | Low latency | Higher latency due to interval-based retrieval |
API call overhead | Minimal overhead (push model) | High overhead with frequent API calls |
Scalability | Easily scales with increasing data volume | More complex scaling with larger environments |
Management Complexity | Simplified setup and management | Requires managing polling schedules and endpoints |
Cost Efficiency | Cost-effective due to reduced API interactions | Higher costs from frequent API requests |
The following AWS services are not supported by CloudWatch Metric Streams. For these services, leverage API polling:
- AWS CloudTrail
- AWS Health
- AWS Trusted Advisor
- AWS X-Ray
If you utilize other AWS services alongside any of these, you can still choose Amazon CloudWatch Metric Streams integration. During the setup, New Relic provides the option to configure API polling specifically for these unsupported services.
Following are the ways to integrate your AWS services with New Relic:
- Via CloudFormation and CloudWatch metric stream.
- Via CloudFormation and API Polling.
- Via Terraform.
- Manually from AWS console.
If you have already integrated your AWS account with New Relic using API Polling, refer to the migration procedure to migrate to CloudWatch Metric Streams.
AWS costs for integration
The integration to Ingest your AWS metrics to New Relic has some impact on your AWS billing. For more details, refer to the following AWS documentations:
- Refer to the AWS CloudWatch pricing page that defines the pricing based on the number of metric updates.
- Refer to the AWS Firehose pricing page, as we sometimes use AWS Kinesis Data Firehose as the data delivery method from AWS to New Relic.
- Refer to the AWS Config pricing page, if you are planning to enable AWS Config to enrich CloudWatch metrics with resource metadata.
- Refer to the Amazon RDS pricing page, if some AWS services use RDS enhanced monitoring that supplies more metrics at a higher frequency.
If you are using the API polling integration for some of your AWS services, some situations may increase the number of calls to the CloudWatch API to exceed the 1 million free limits granted by AWS and increase your CloudWatch bill. This may happen when you:
- Enable additional integrations through API Polling
- Add AWS resources to the integrations
- Scale integrations across more regions.
AWS logs ingestion
To connect your AWS account with New Relic for logs ingestion, refer to Forward AWS service logs to New Relic.