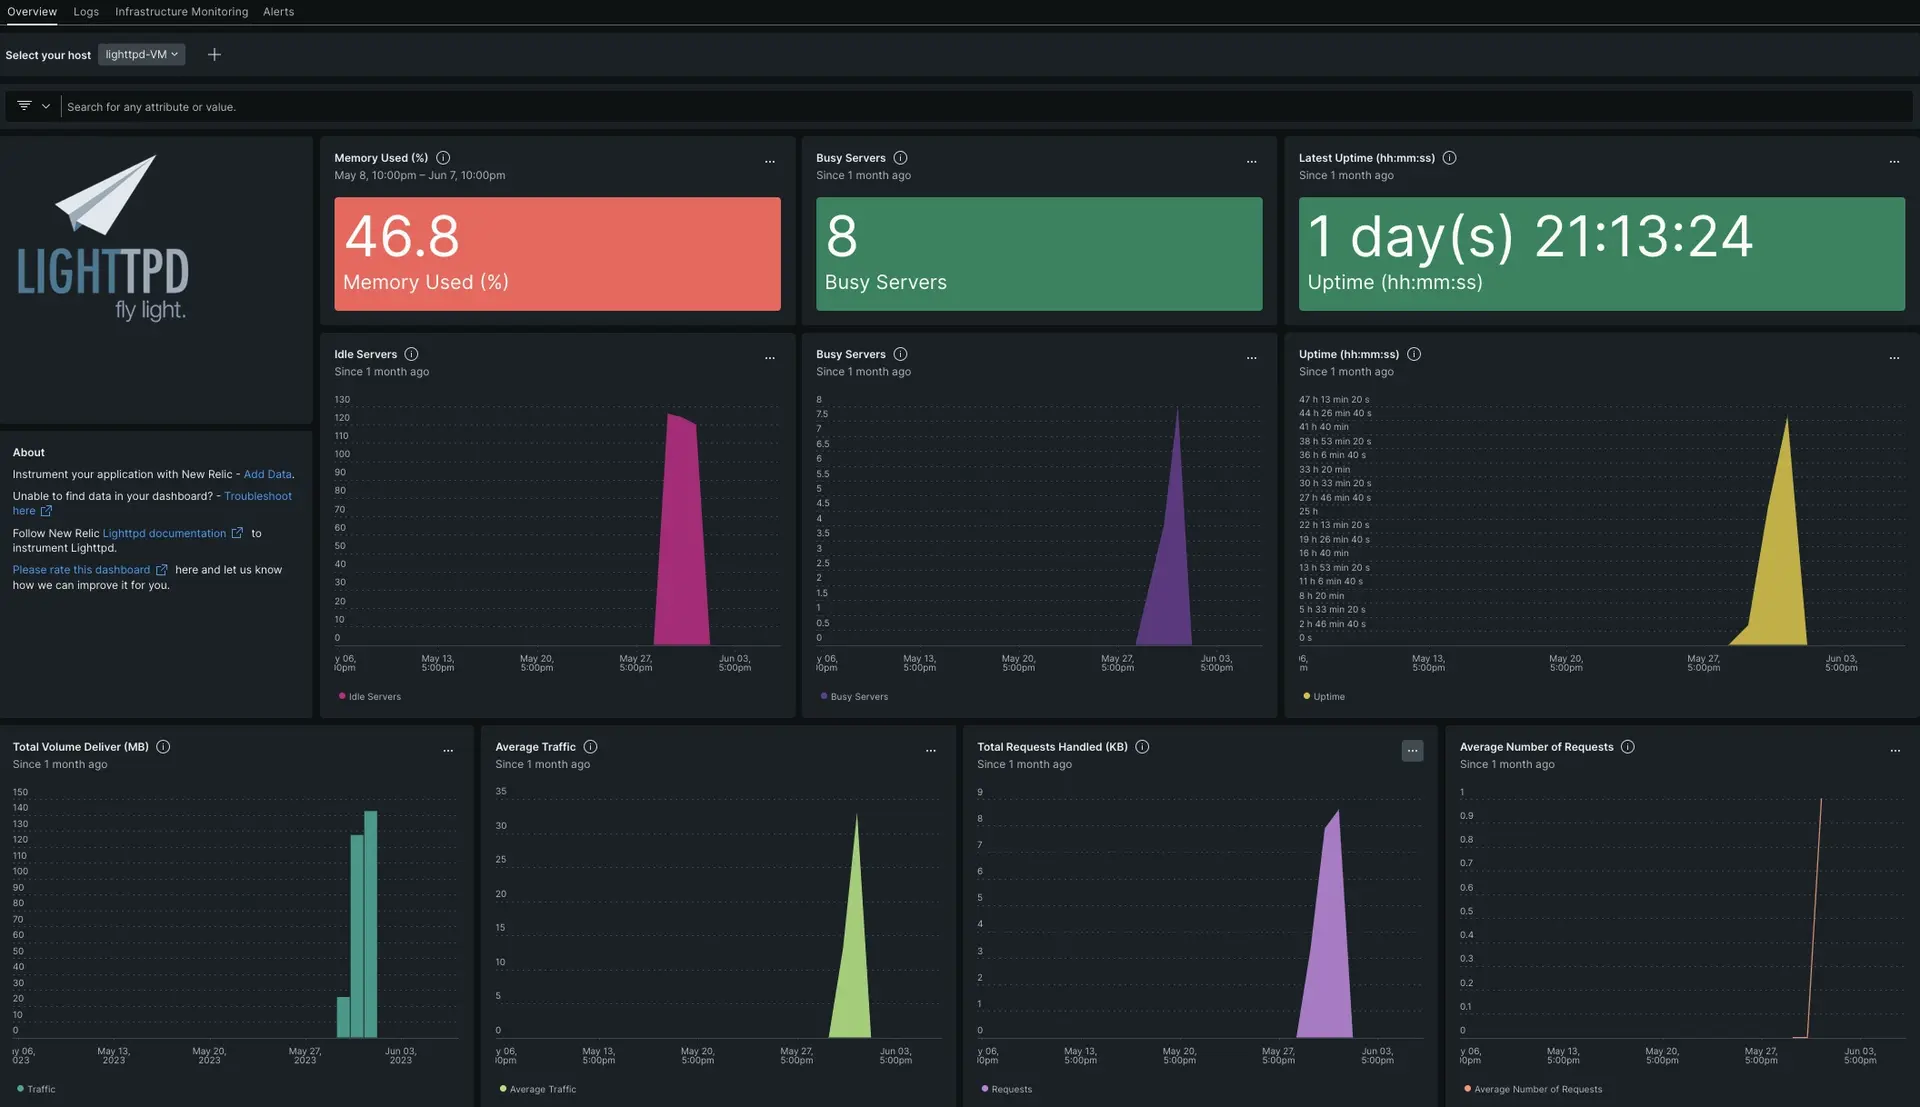
With our Lighttpd dashboard, your team can monitor outcome measures and inventory data. Lighttpd monitoring provides important information to help you construct a complete picture of your web server's performance. This performance data includes uptime, network in bytes and packets, number of connections, and more. Metric data can be seen on our pre-built dashboards, and you can also create your own custom searches, graphs, and alert policies. Our Lighttpd integration uses a NRI-Flex setup.

After setting up the integration with New Relic, see your data in dashboards like these, right out of the box.
Install the infrastructure agent
To get data into New Relic, install our infrastructure agent. Our infrastructure agent collects and ingests data so you can keep track of your app's performance. The version should be 1.10.7 or later to support NRI-Flex integration.
You can install the infrastructure agent two different ways:
- Our guided install is a CLI tool that inspects your system and installs the infrastructure agent alongside the application monitoring agent that best works for your system. To learn more about how our guided install works, check out our Guided install overview.
- If you'd rather install our infrastructure agent manually, you can follow a tutorial for manual installation for Linux, Windows, or macOS.
Integrate Lighttpd with New Relic
Once installed, the infrastructure agent can ingest data from your app and send it to New Relic, but you still need to integrate— or establish a line of communication—between the agent and your app. Once integrated, you can get started with an out of the box monitoring solution for your Lighttpd app.
Manually configure the lighttpd.conf file
To export metrics on the url http://INSERT_DOMAIN:INSERT_PORT/server-status?json, use the following steps:
Go to lighttpd config file path.
bash$cd /etc/lighttpd/Open
lighttpd.conffile to edit.bash$sudo nano lighttpd.confAdd
mod_statusinsideserver.modulesobject.Add
status.status-url = /server-statusafterserver.modules.Update
server.document-rootwith the lighttpd file path/var/www/html/lighttpd-webpageUpdate
server.porton which you're running lighttpd.server.port = 9880.Open
http://INSERT_DOMAIN:INSERT_PORT/server-status?jsonon the browser to check server related metrics.Here is a sample configuration file:
server.modules = ("mod_indexfile","mod_access”,"mod_alias","mod_redirect”,"mod_status")server.document-root = "/var/www/html/lighttpd-webpage"server.upload-dirs = ( "/var/cache/lighttpd/uploads" )server.errorlog = "/var/log/lighttpd/error.log"server.pid-file = "/run/lighttpd.pid"server.username = "www-data"server.groupname = "www-data"server.port = 9880status.status-url = "/server-status”
NRI-Flex configuration
Once you've installed the infrastructure agent on your host, nri-flex binary is also installed with it.
If the infrastructure agent was not installed, follow the installation steps of nri-flex from nri-flex repository.
To create a flex configuration file follow these steps:
Create a file named
lighttpd-http-config.ymlin this path:bash$/etc/newrelic-infra/integrations.dUpdate the file
lighttpd-http-config.ymlwith these configurations:EVENT_TYPE: You can considerEVENT_TYPEas a New Relic database table that you can query using NRQL (for example,LighttpdStatusSample).URL: This contains the json-formatted metrics (for example,http://127.0.0.1:9880/server-status?json).
Here is a sample configuration file:
---integrations:- name: nri-flex# interval: 30sconfig:name: lighttpdFlexapis:- event_type: INSERT_EVENT_TYPEurl: INSERT_URL
Forward Lighttpd logs to New Relic
You can use our log forwarding to forward Lighttpd logs to New Relic.
On Linux machines, your log file named logging.yml should be present in the path below. If you don't see your log file, then you will need to create it by following the above log forwarding documentation.
$/etc/newrelic-infra/logging.d/Once the log file is created, add the following script to the logging.yml file:
- name: error.log file: /var/log/lighttpd/error.log attributes: logtype: lighttpd_logRestart the New Relic infrastructure agent and lighttpd service
Before you can start reading your data, use the instructions in our infrastructure agent docs to restart your infrastructure agent.
$sudo systemctl restart lighttpd.service && sudo systemctl restart newrelic-infra.serviceMonitor your application
You can choose our pre-built dashboard template named Lighttpd to monitor your Lighttpd server metrics. Follow these steps to use our pre-built dashboard template:
Go to one.newrelic.com and click on + Integrations & Agents.
Click on the Dashboards tab.
In the search box, type
lighttpd.When you see our pre-build dashboard, click on it to install it in your account.
Once your application is integrated by following the above steps, the dashboard should display metrics.
To instrument the Lighttpd quickstart and to see metrics and alerts, you can also follow our Lighttpd quickstart page that has an Install now button.
Here are some example queries:
Example: View the captured metrics on the New Relic query builder.
SELECT * FROM LighttpdStatusSample LIMIT MAXExample: Check the active connection per server.
SELECT latest(BusyServers) FROM LighttpdStatusSample TIMESERIES AUTO
See Lighttpd metrics in a dashboard
With only the infrastructure agent installed and instrumented with your app, you can view your raw data in our Metrics & events. Our default transform that raw data into charts and graphs, which provide a bird's eye view of your system's health.
To instrument the Lighttpd quickstart, install our default dashboards, and to see metrics and alerts, you can also follow our Lighttpd quickstart page by clicking on the Install now button.
What's next?
To learn more about building NRQL queries and generating dashboards, check out these docs:
- Introduction to the query builder to create basic and advanced queries.
- Introduction to dashboards to customize your dashboard and carry out different actions.
- Manage your dashboard to adjust your display mode, or to add more content to your dashboard.