Use the Pixie entities to see golden metrics and a sample of individual full-body requests sent to a specific service using a specific protocol. Pixie entities are powered by data that has been automatically traced by Pixie. Select a protocol below to learn more:
You can find the Pixie entities under the Other entities section of the All entities page:
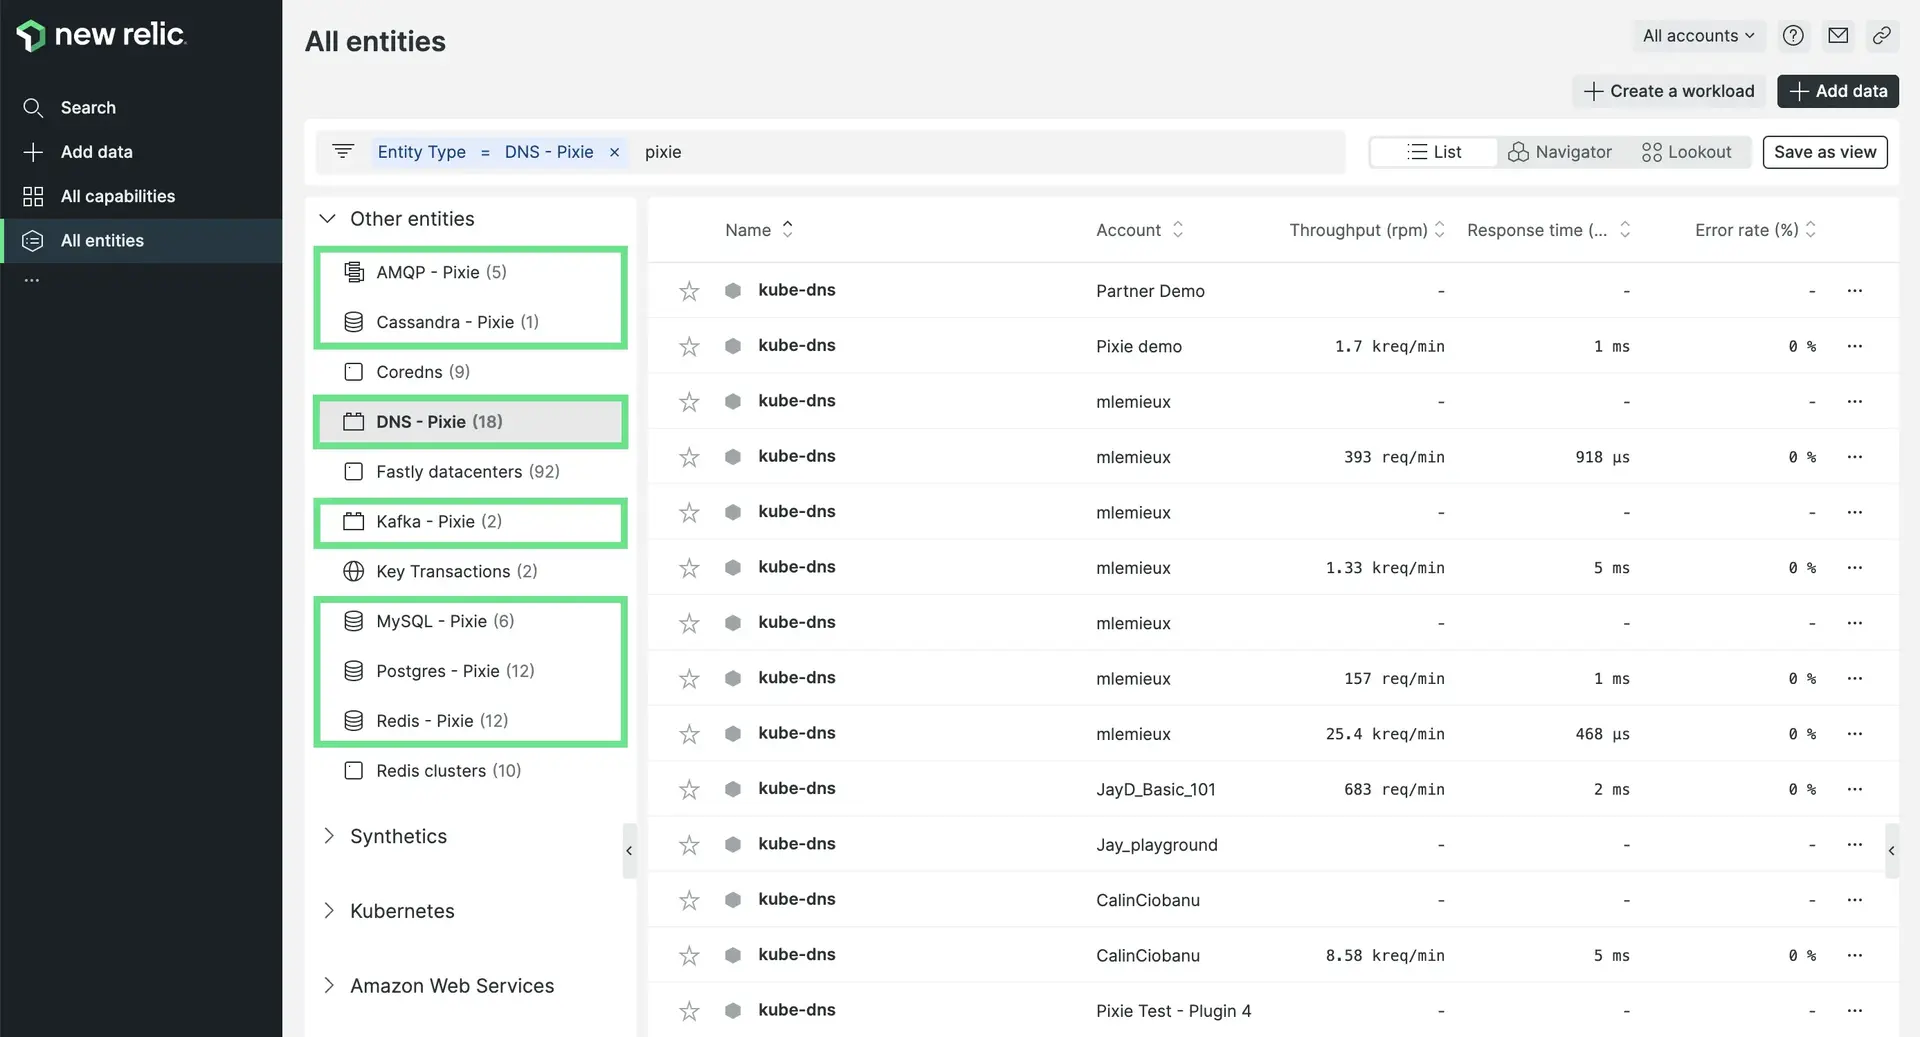
Pixie entities show up under the All Entities section.
重要
If you are missing any of these Pixie entities, check your Customize Pixie Ingest configuration. You may have disabled ingest for a certain protocol.
DNS
Select a service from the DNS - Pixie entity list to see time series graphs of response time, error rate and throughput for all DNS requests sent to that service. Inspect the Sampled DNS Requests table to see full-body DNS requests and responses received by this service.
DNS requests automatically traced by Pixie can be used to:
- Quickly determine which services are making DNS requests.
- Get high-level DNS response time and throughput information.
- Observe imbalances of throughput between DNS servers.
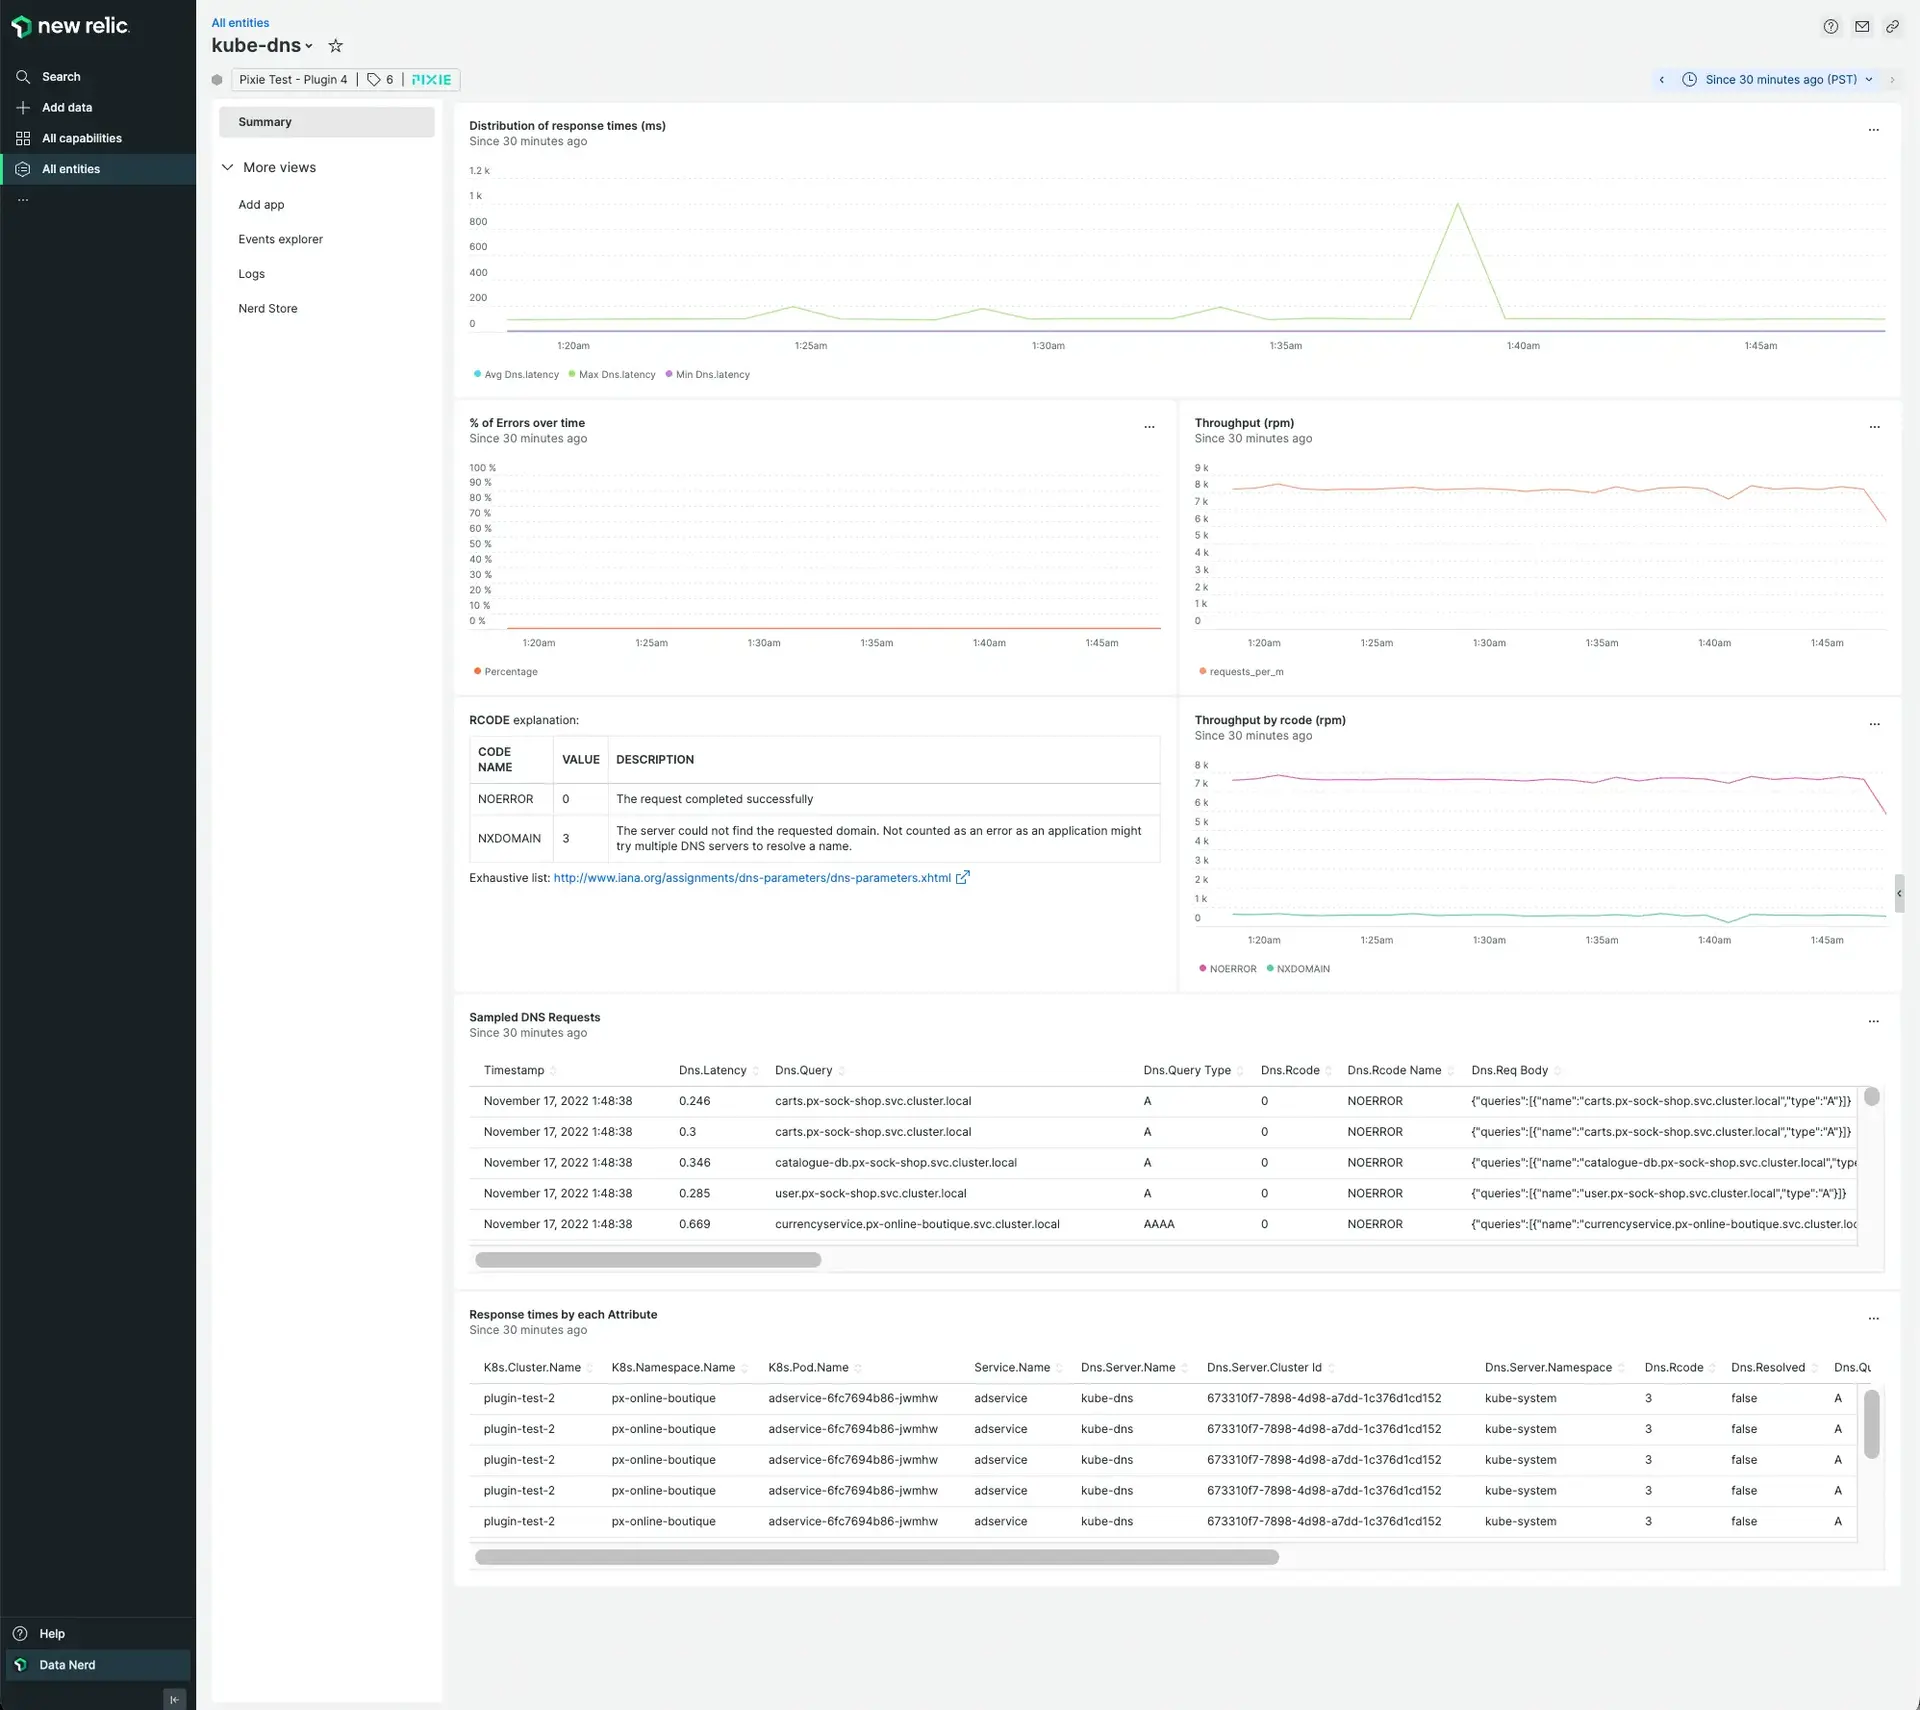
Find the DNS - Pixie entity in the All Entities section.
MySQL
Select a service from the MySQL - Pixie entity list to see time series graphs of response time, error rate and throughput for all MySQL requests sent to that service. Inspect the "Sampled MySQL Requests" table to see full-body MySQL requests and responses received by this service.
MySQL requests automatically traced by Pixie can be used to:
- See response time, error rate and throughput per service.
- See response time per MySQL command.
- Inspect the body of slow MySQL commands.
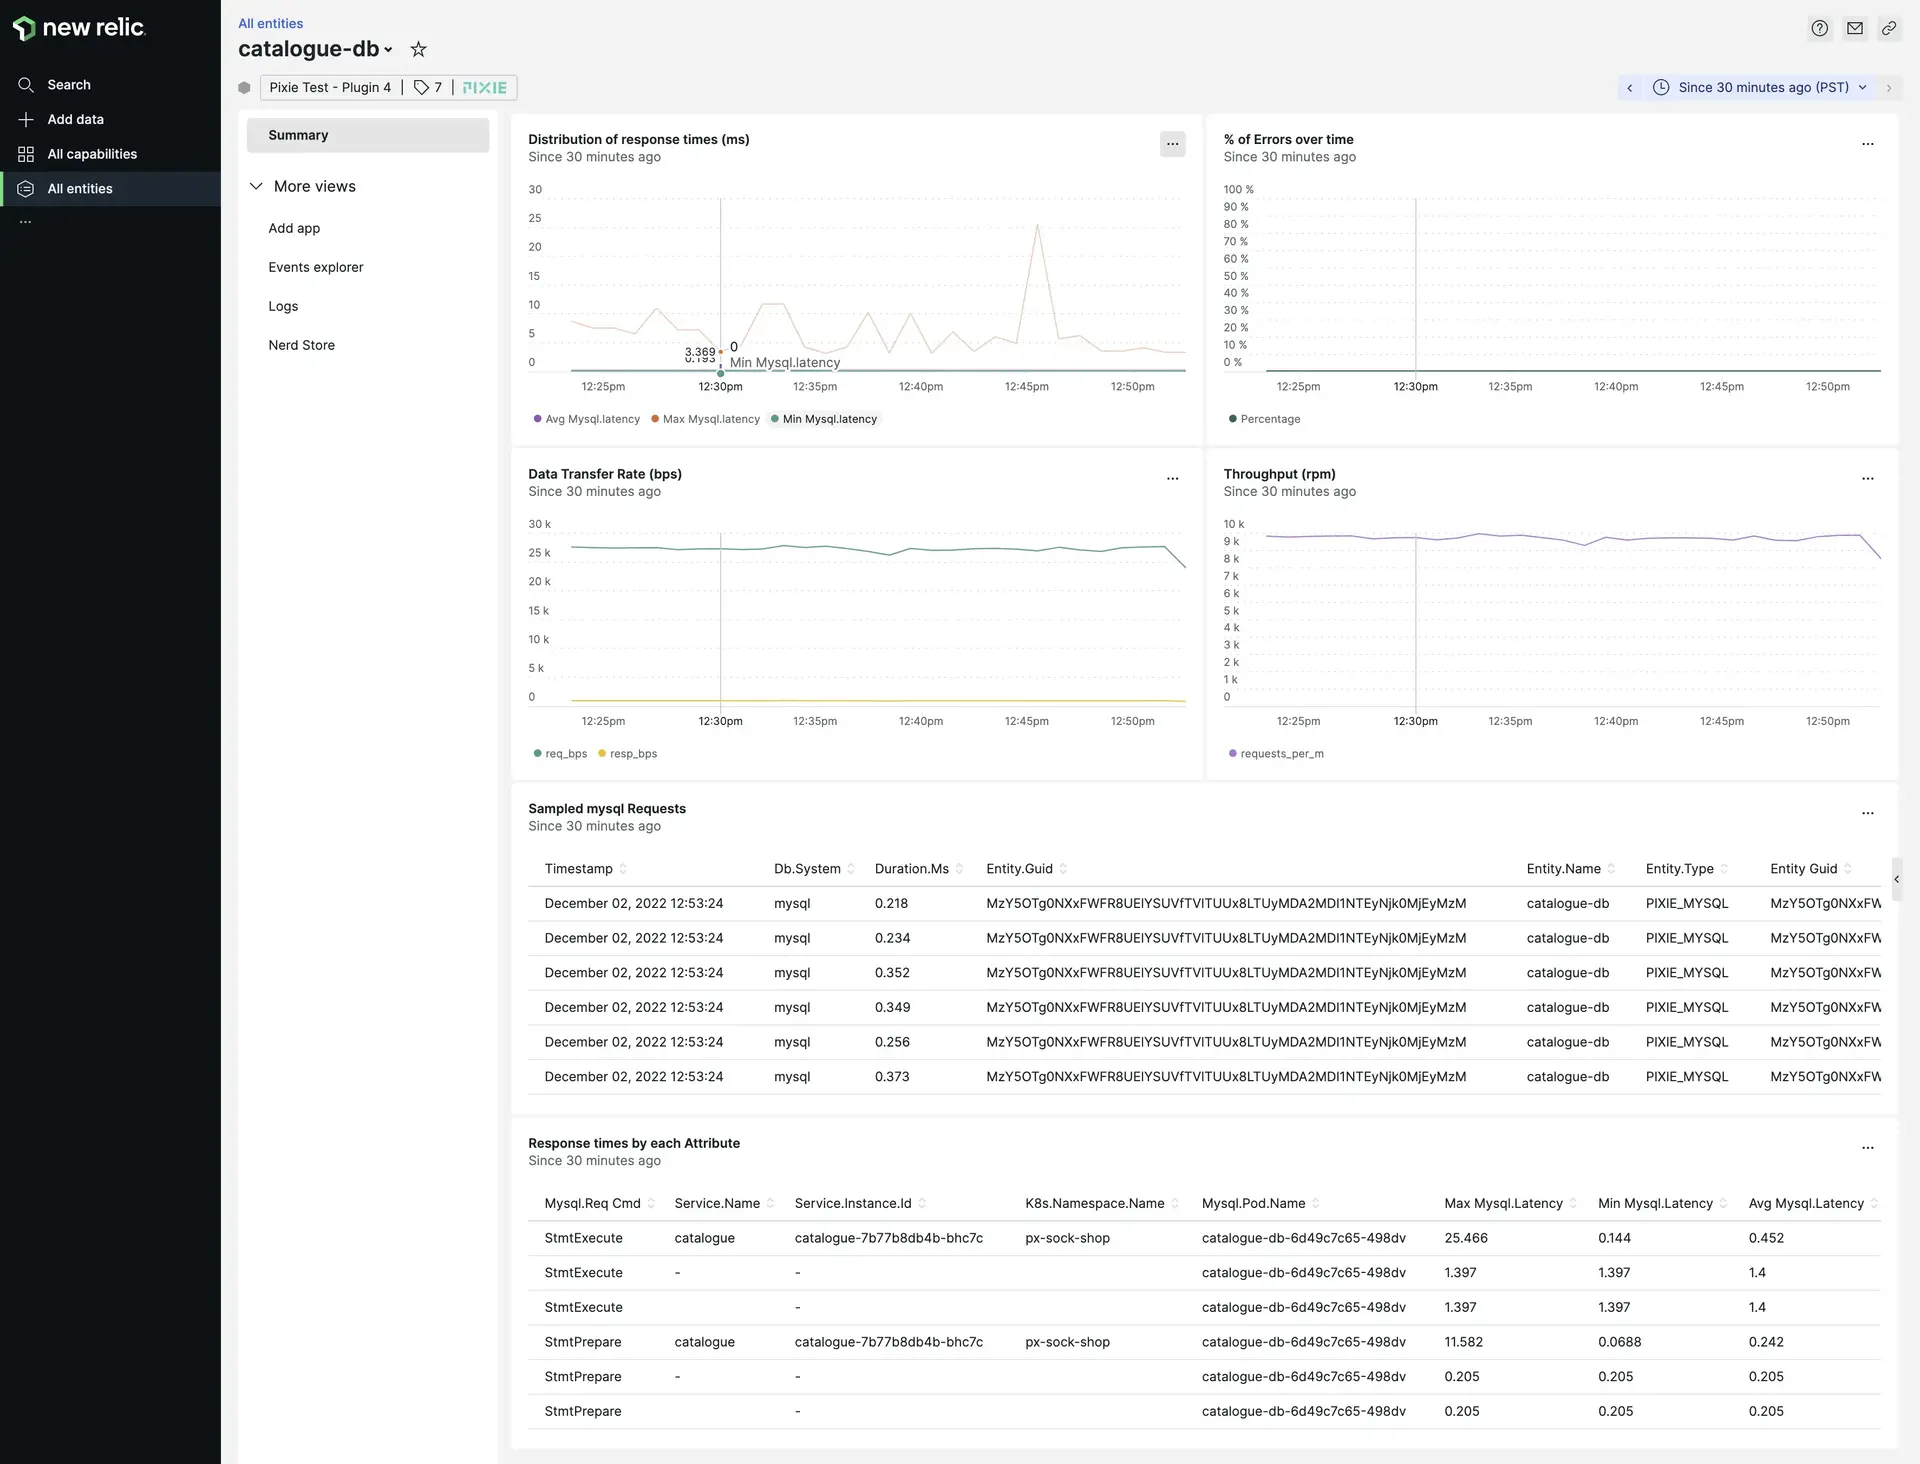
Find the MySQL - Pixie entity in the All Entities section.
PostgreSQL
Select a service from the Postgres - Pixie entity list to see time series graphs of response time, error rate and throughput for all PostgreSQL requests sent to that service. Inspect the "Sampled Postgres Requests" table to see full-body PostgreSQL requests and responses received by this service.
PostgreSQL requests automatically traced by Pixie can be used to:
- See response time, error rate and throughput per service.
- See response time per PostgreSQL command.
- Inspect the body of slow PostgreSQL commands.
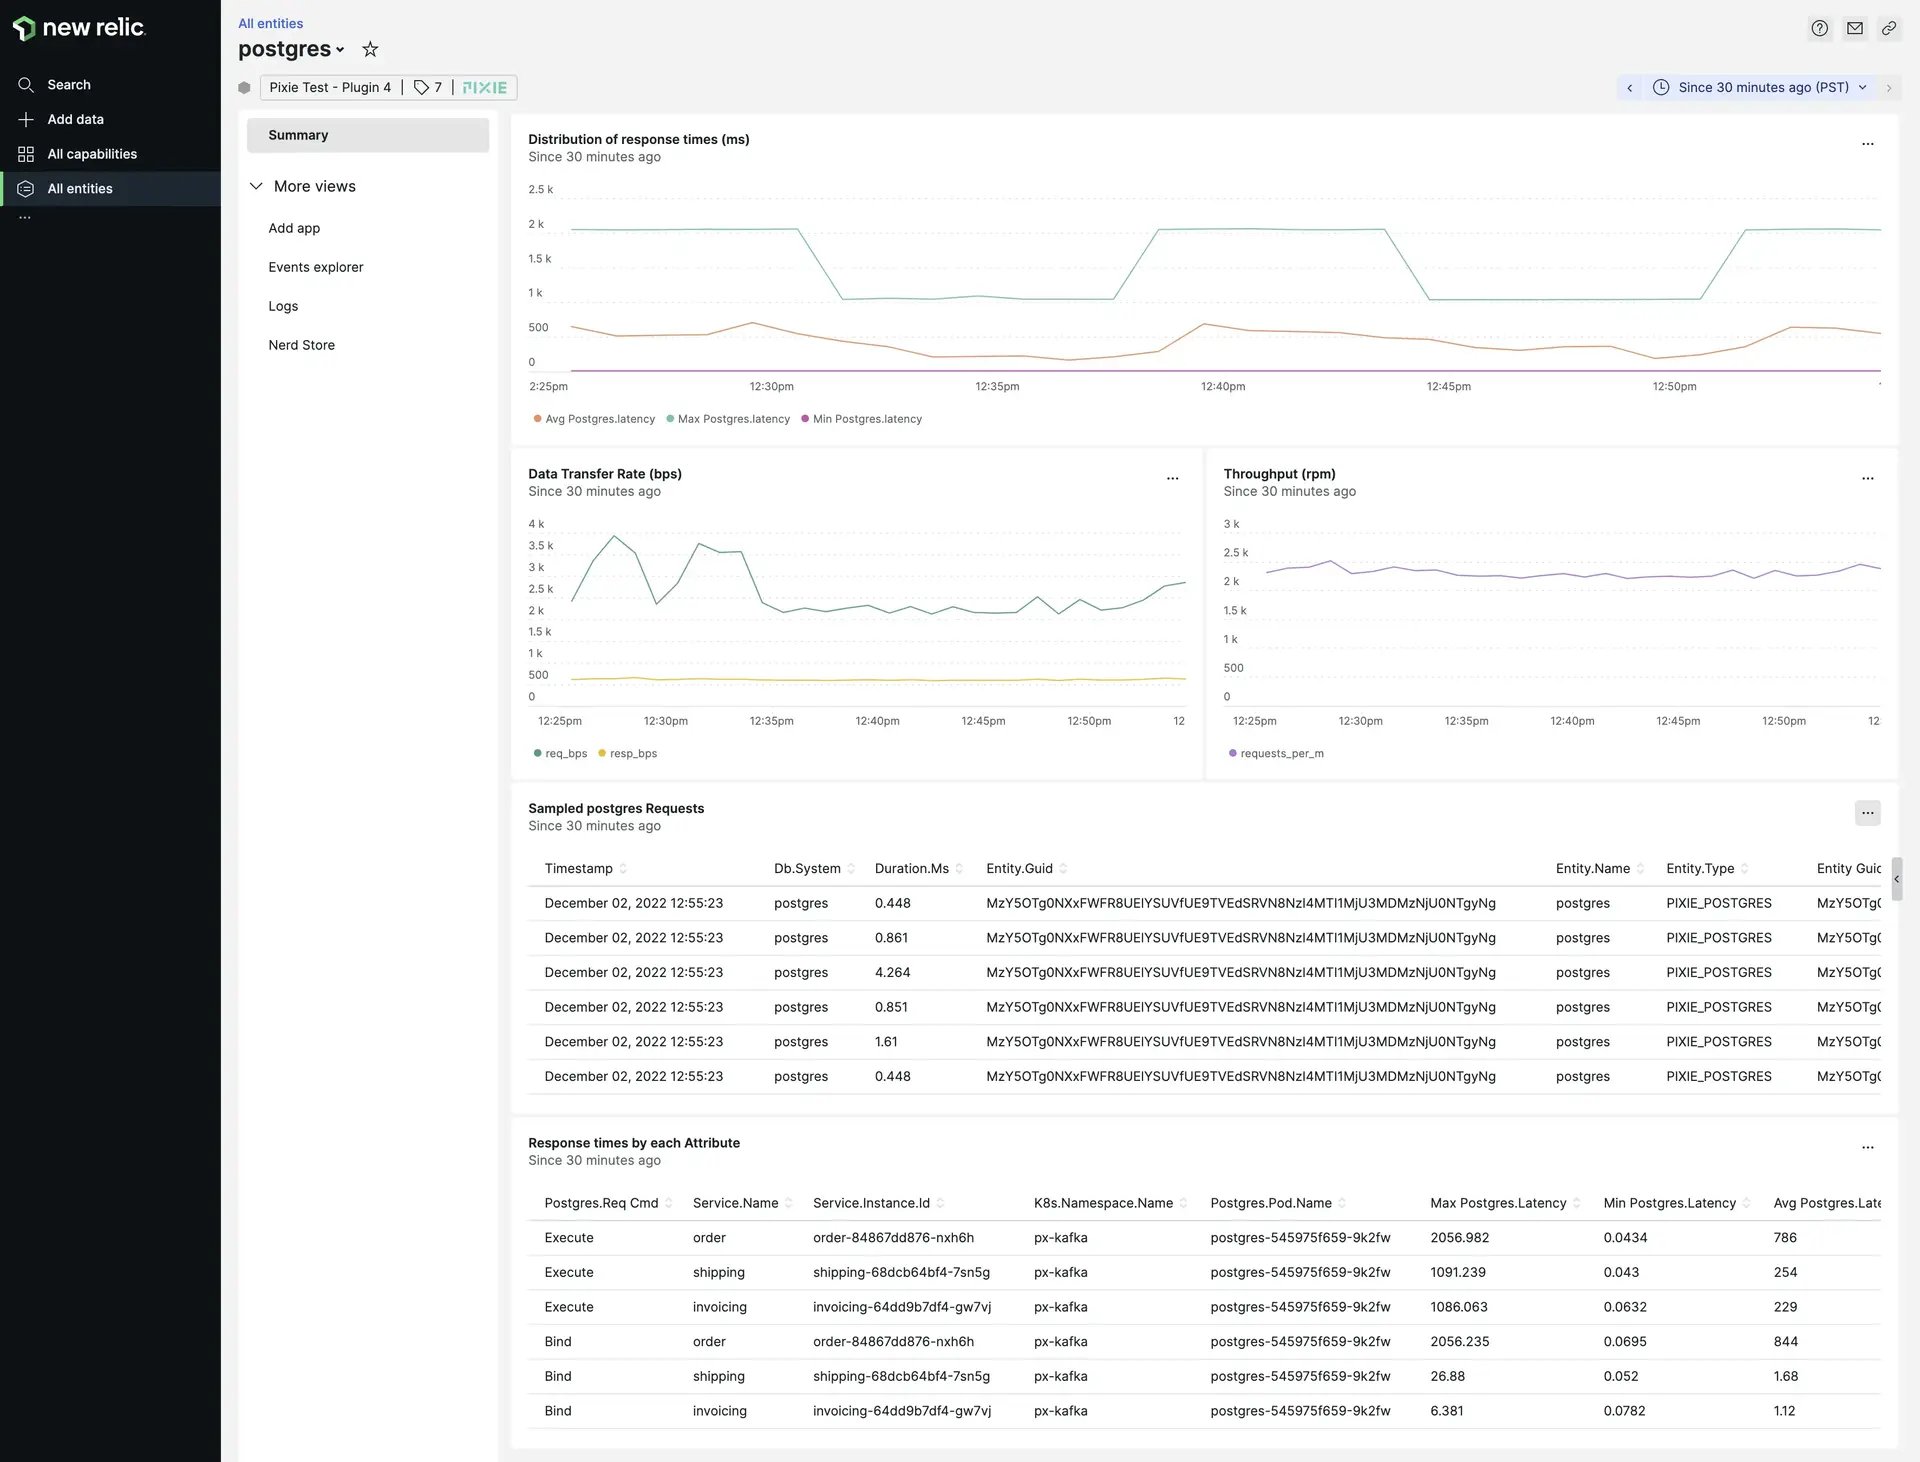
Find the Postgres - Pixie entity in the All Entities section.
Redis
Select a service from the Redis - Pixie entity list to see time series graphs of response time, error rate and throughput for all Redis requests sent to a service. Inspect the "Sampled Redis Requests" table to see full-body Redis requests and responses received by this service.
Redis requests automatically traced by Pixie can be used to:
- See response time, error rate and throughput per service.
- See response time per Redis command.
- Inspect the body of slow Redis commands.
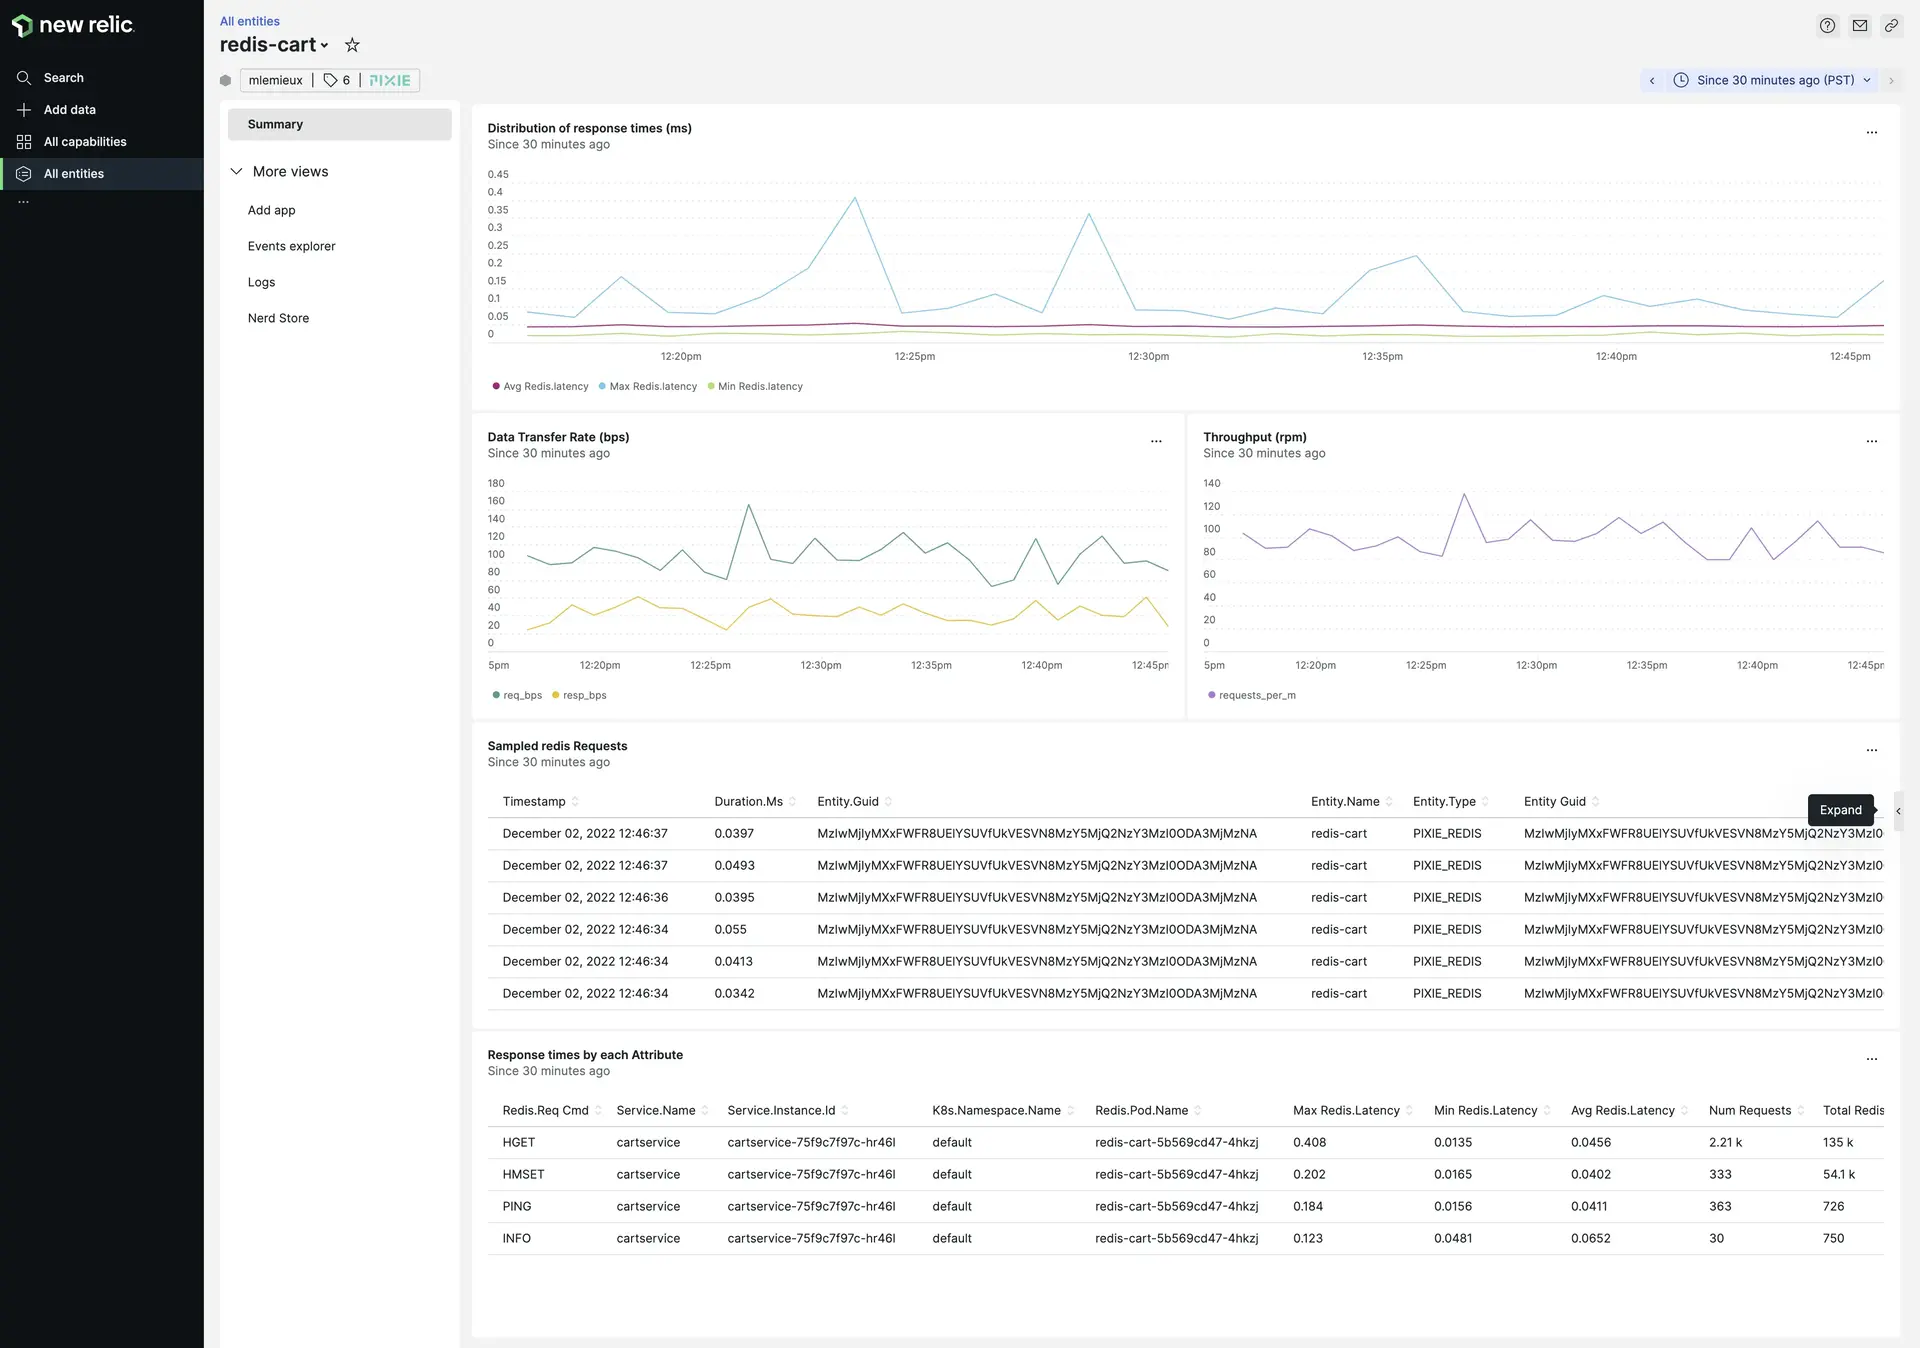
Find the Redis - Pixie entity in the All Entities section.
Kafka
Select a service from the Kafka - Pixie entity list to see time series graphs of response time, error rate and throughput for all Kafka messages sent to that service. Inspect the "Sample of Kafka Requests" table to see full-body Kafka messages received by this service.
Kafka messages traced by Pixie can be used to:
- See response time, error rate and throughput per service.
- See response time per Kafka command.
- Inspect the body of slow Kafka messages.
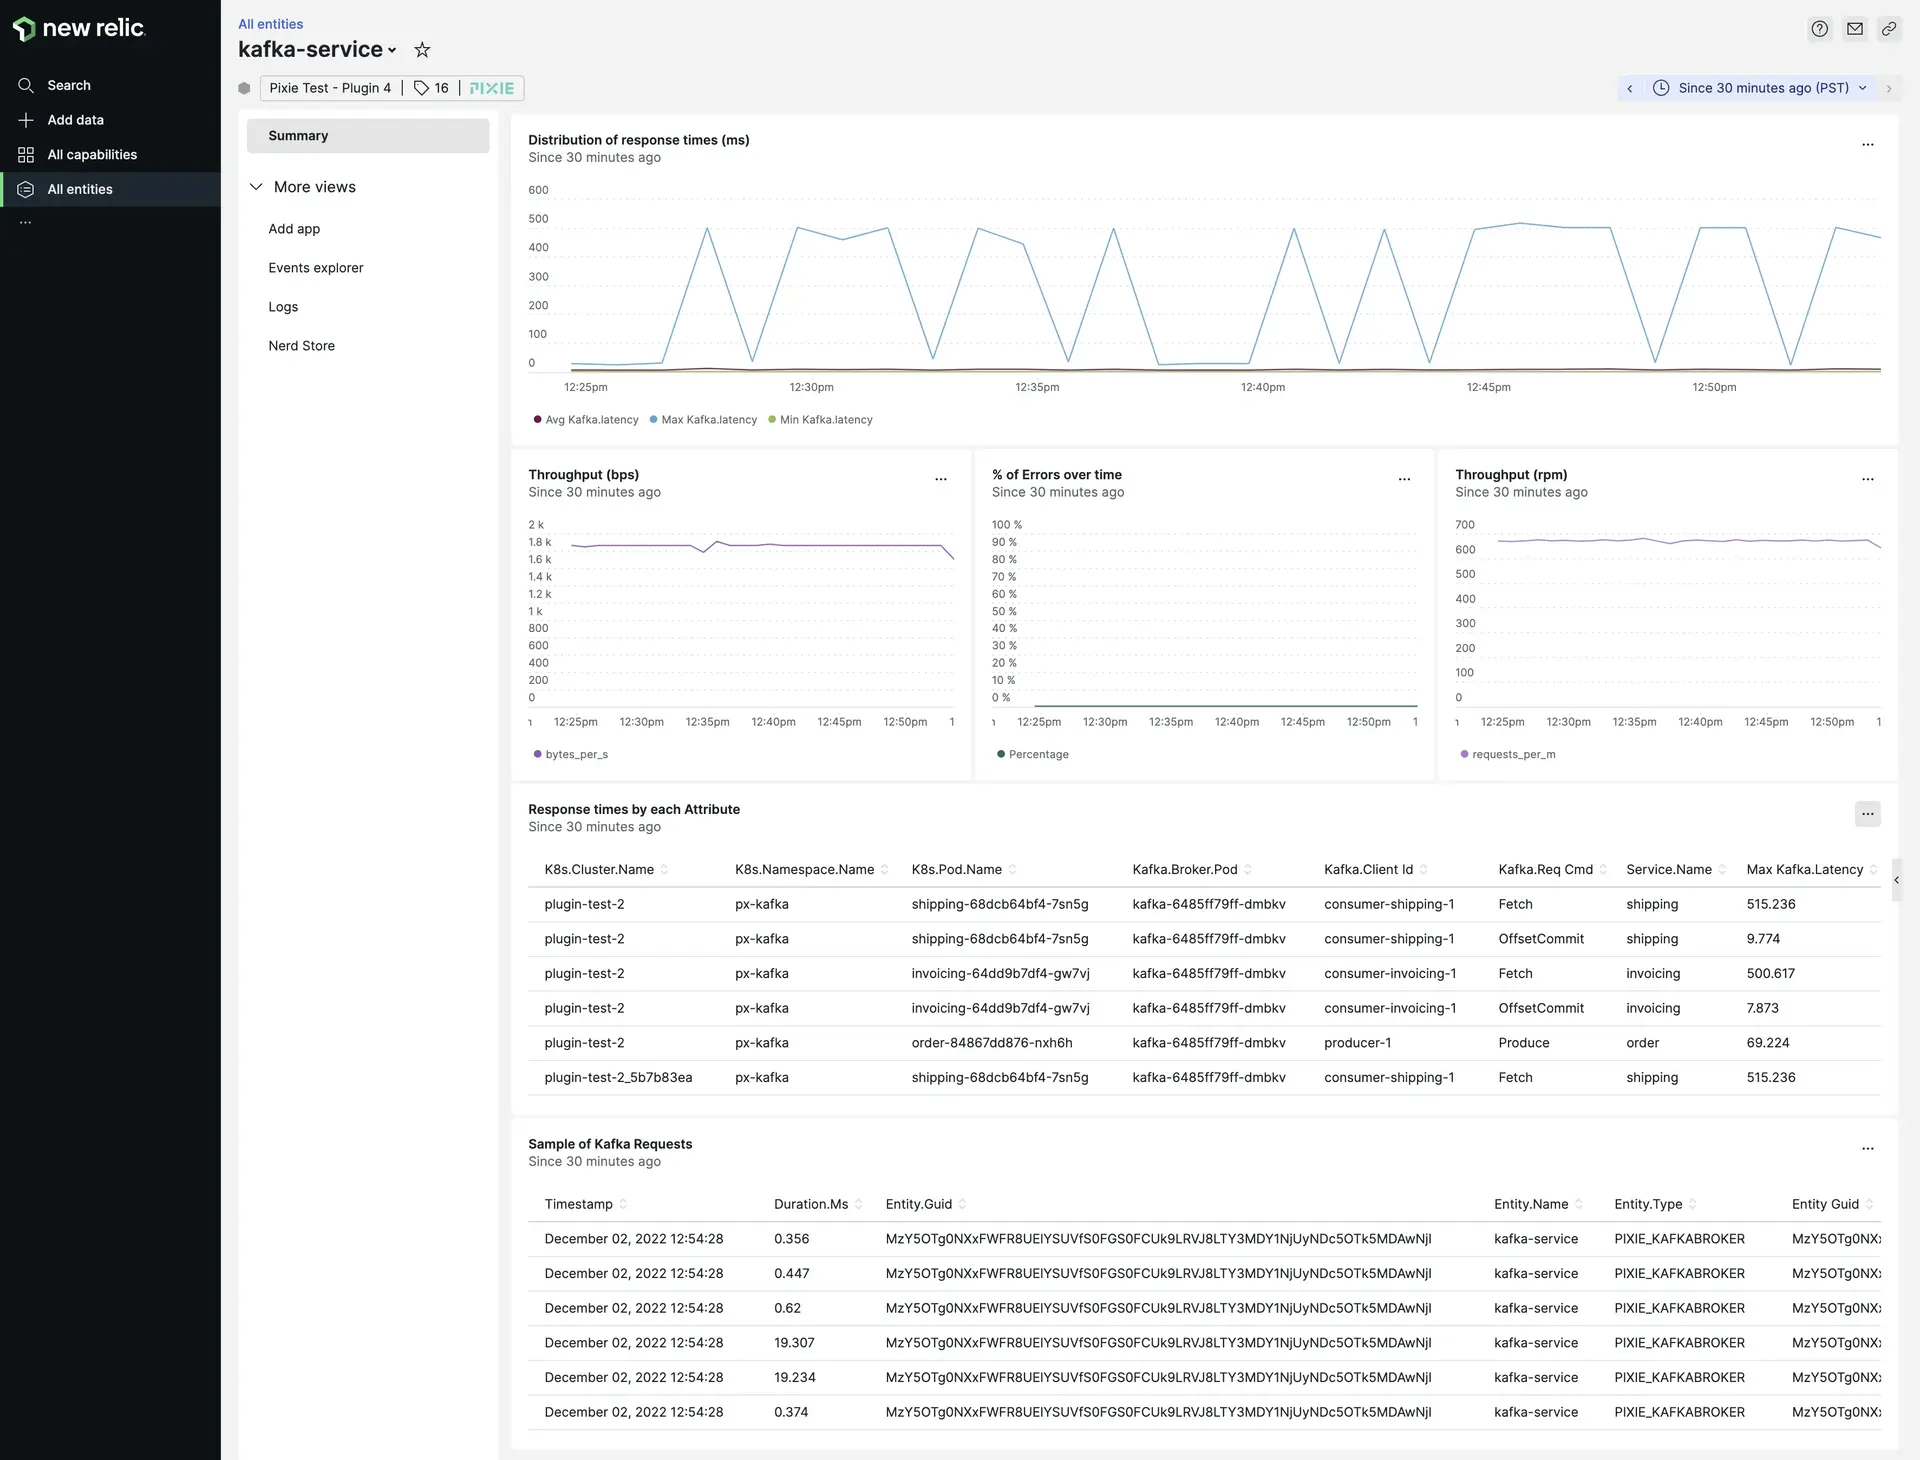
Find the Kafka - Pixie entity in the All Entities section.
AMQP
Select a service from the AMQP - Pixie entity list to see time series graphs of response time, error rate and throughput for all AMQP messages sent to that service.
AMQP messages traced by Pixie can be used to:
- See response time, error rate and throughput per service and pod.
- See a list of AMQP consumers and producers.
- See response time per AMQP method.
- Inspect the body of traced AMQP messages.
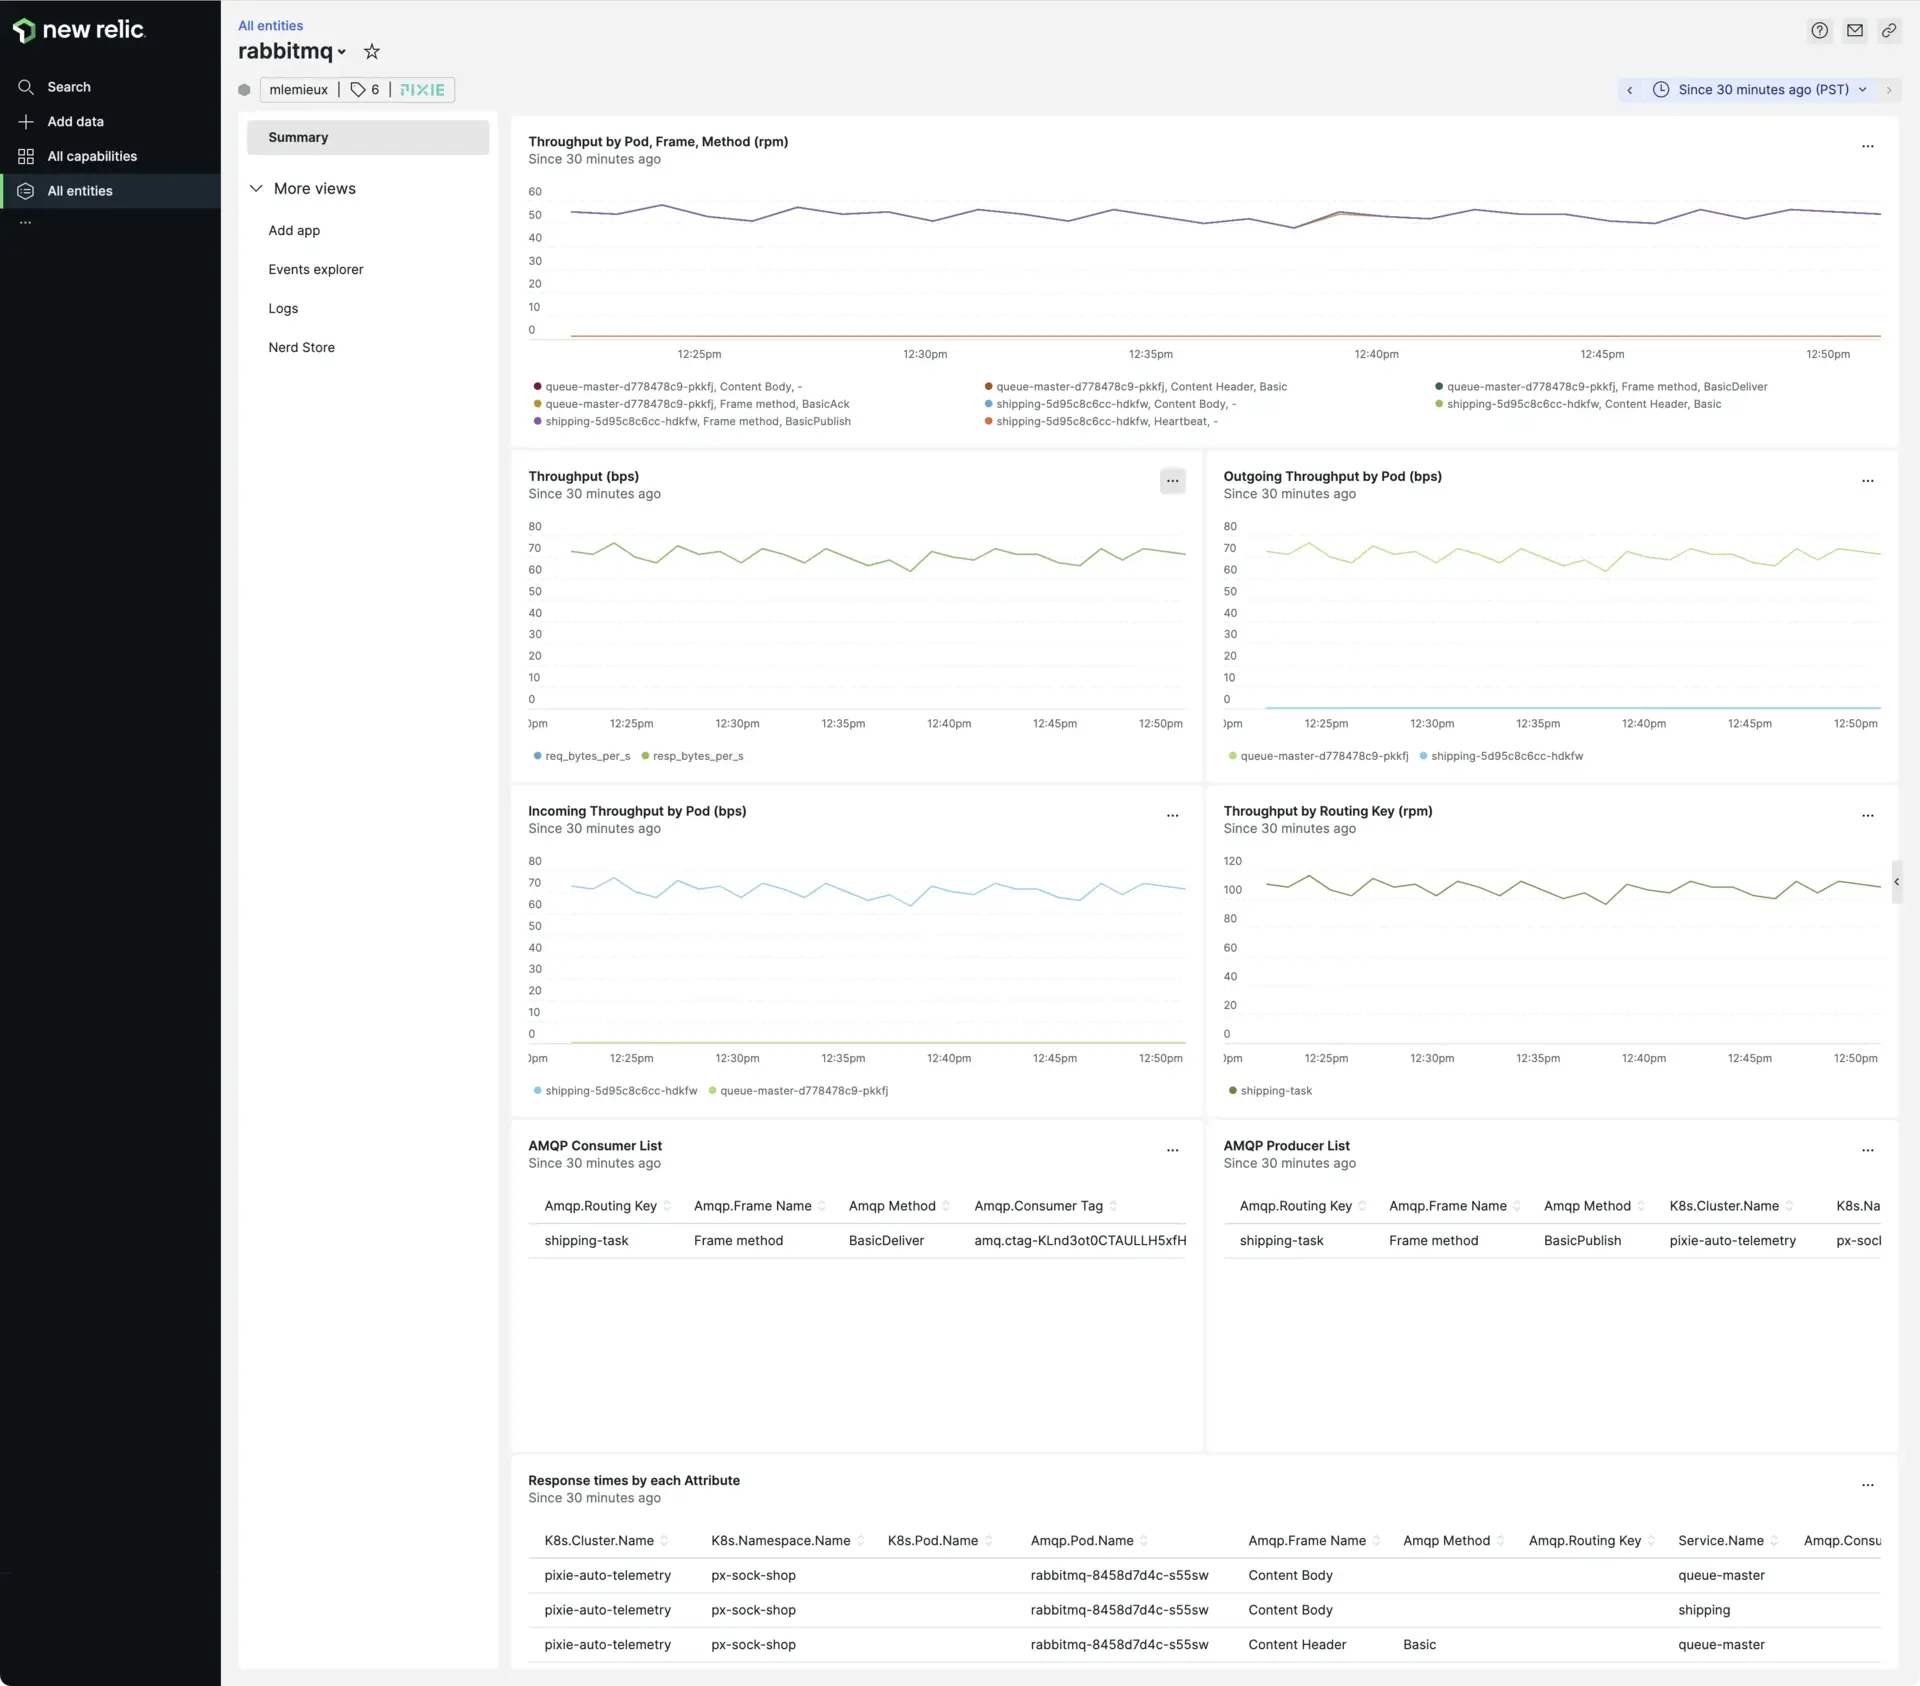
Find the AMQP - Pixie entity in the All Entities section.