New Relic provides control plane support for your Kubernetes integration, allowing you to monitor and collect metrics from your cluster's control plane components. That data can then be found in New Relic and used to create queries and charts.
ヒント
This page refers to the Kubernetes integration v3. If you're running v2, see how to configure control plane monitoring for v2.
Features
We monitor and collect metrics from the following control plane components:
- etcd: leader information, resident memory size, number of OS threads, consensus proposals data, etc. For a list of supported metrics, see etcd data.
- API server: rate of
apiserverrequests, breakdown ofapiserverrequests by HTTP method and response code, etc. For the complete list of supported metrics, see API server data. - Scheduler: requested CPU/memory vs available on the node, tolerations to taints, any set affinity or anti-affinity, etc. For the complete list of supported metrics, see Scheduler data.
- Controller manager: resident memory size, number of OS threads created, goroutines currently existing, etc. For the complete list of supported metrics, see Controller manager data.
Compatibility and requirements
- Most managed clusters, including AKS, EKS and GKE, don't allow outside access to their control plane components. That's why on managed clusters, New Relic can only obtain control plane metrics for the API server, and not for etcd, the scheduler, or the controller manager.
- When deploying the solution in unprivileged mode, control plane setup will require extra steps and some caveats might apply.
- OpenShift 4.x uses control plane component metric endpoints that are different than the default.
Control plane component
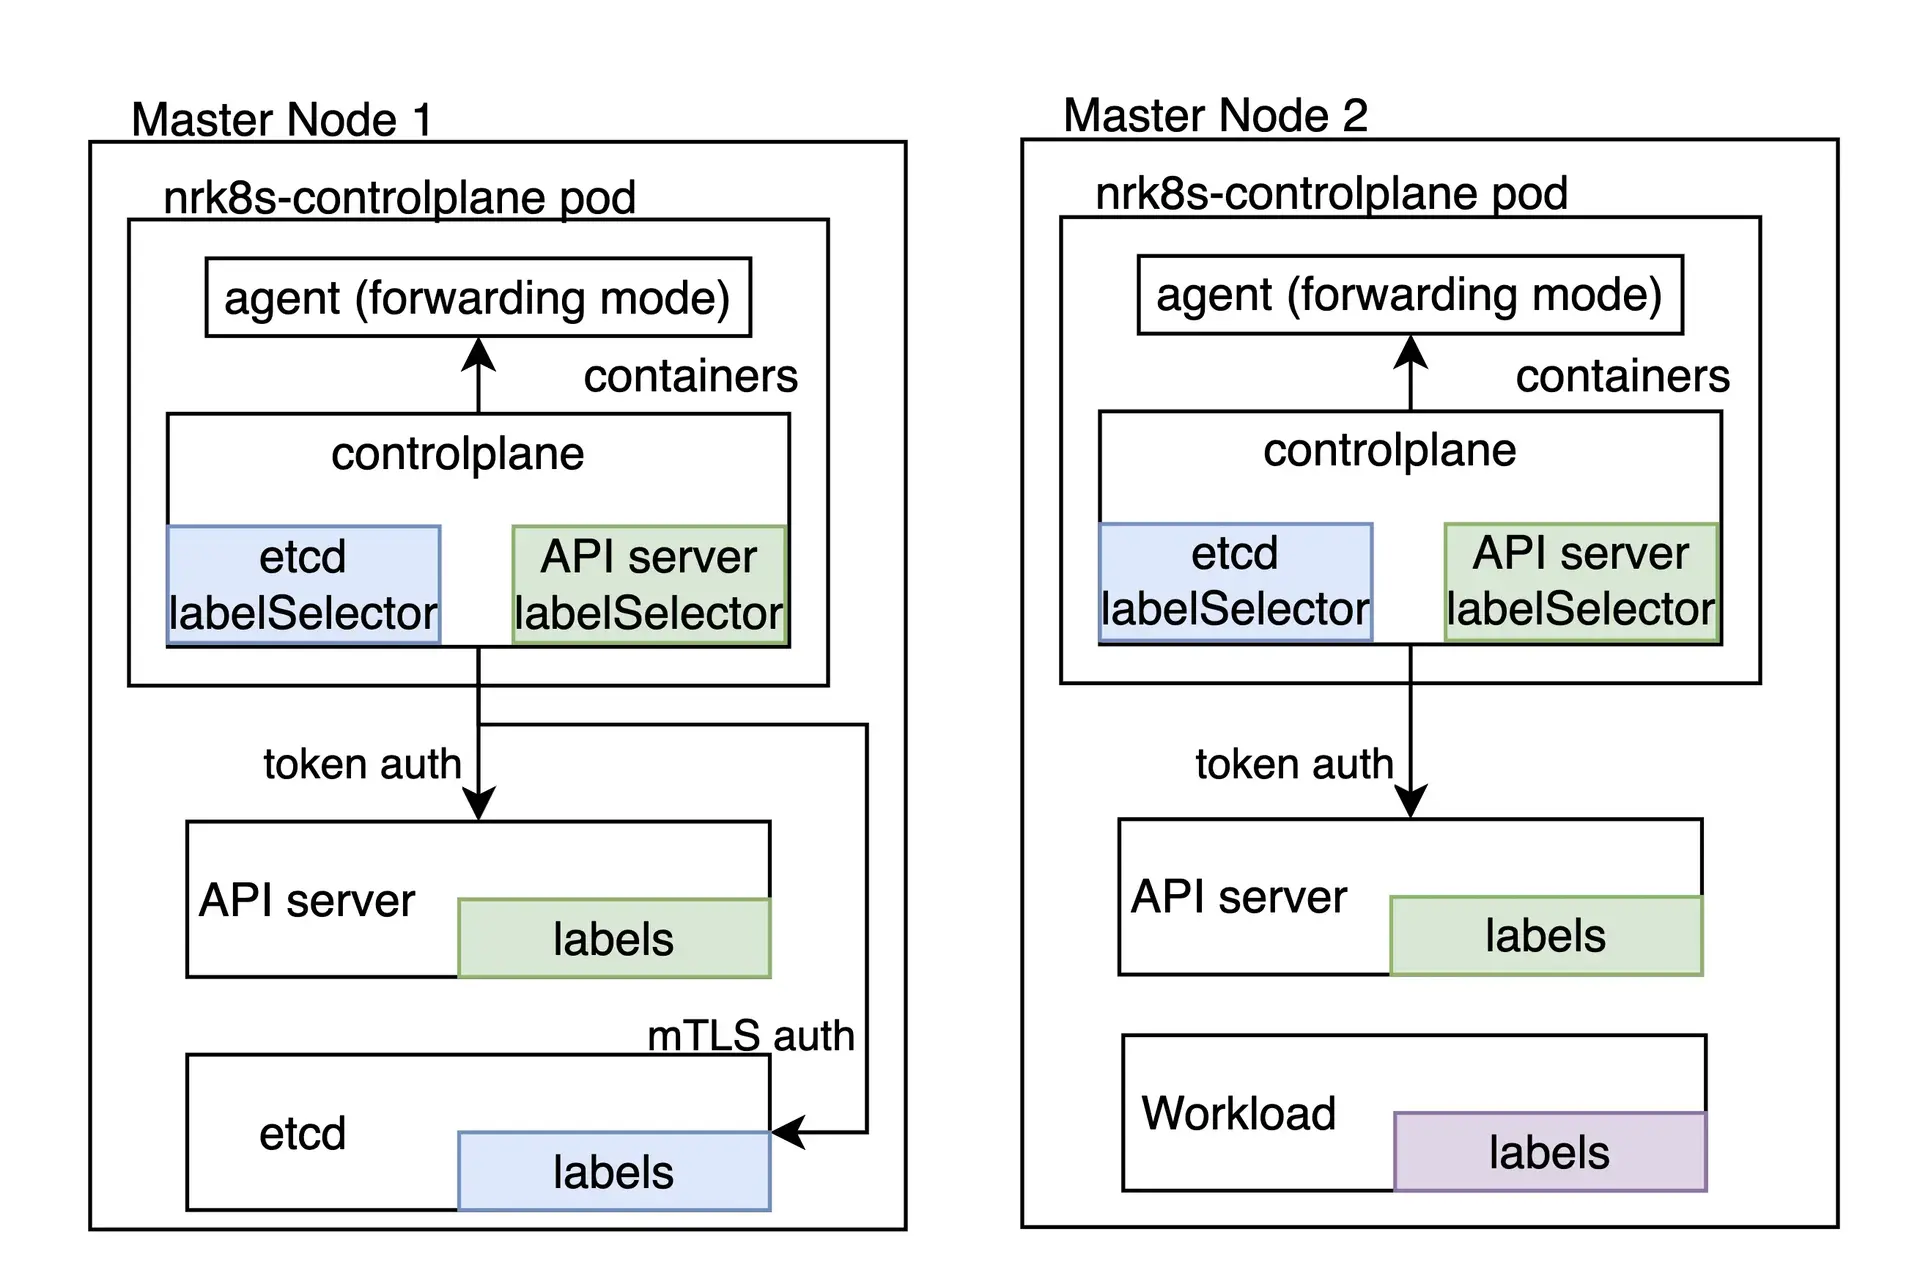
The task of monitoring the Kubernetes control plane is a responsibility of the nrk8s-controlplane component, which by default is deployed as a DaemonSet. This component is automatically deployed to control plane nodes, through the use of a default list of nodeSelectorTerms which includes labels commonly used to identify control plane nodes, such as node-role.kubernetes.io/control-plane. Regardless, this selector is exposed in the values.yml file and therefore can be reconfigured to fit other environments.
Clusters that do not have any node matching these selectors will not get any pod scheduled, thus not wasting any resources and being functionally equivalent of disabling control plane monitoring altogether by setting controlPlane.enabled to false in the Helm Chart.
Each component of the control plane has a dedicated section, which allows to individually:
- Enable or disable monitoring of that component
- Define specific selectors and namespaces for discovering that component
- Define the endpoints and paths that will be used to fetch metrics for that component
- Define the authentication mechanisms that need to be used to get metrics for that component
- Manually specify endpoints that skip autodiscovery completely

You can check all configuration options available in the values.yaml of the nri-kubernetes chart under the controlPlane key.
If you're installing the integration through the nri-bundle chart you need to pass the values to the corresponding subchart. For example to disable the etcd monitoring in the controlPlane component you can do the following:
newrelic-infrastructure: controlPlane: config: etcd: enabled: falseAutodiscovery and default configuration
By default, our Helm Chart ships a configuration that should work out of the box for some control plane components for on-premise distributions that run the control plane inside the cluster, such as Kubeadm or minikube.
Notice that since autodiscovery relies on pod labels as a discovery mechanism, it does not work in cloud environments or whenever the control plane compoenents are not running inside the cluster. However, static endpoint can be leveraged in these scenarios if control plane components are reachable.
hostNetwork and privileged
In versions higher than 3, the privileged flag affects only the securityContext objects, that is, whether containers are run as root with access to host metrics or not. All the integration components default now to hostNetwork: false, except the pods that get metrics from the control plane that have hostNetwork: true as it is required to reach the control plane endpoints in most distributions. The hostNetwork value for all components can be changed, individually or globally, using the hostNetwork toggle in your values.yaml.
ヒント
For specific settings related to version 2, see Autodiscovery and default configuration: hostNetwork and privileged.
If running pods with hostNetwork is not acceptable whatsoever, due to cluster or other policies, control plane monitoring is not possible and should be disabled by setting controlPlane.enabled to false.
If you have some advanced configuration that includes custom autodiscovery or static endpoint that can be used to monitor the control plane without hostNetwork check project's README and look for controlPlane.hostNetwork toogle in the values.yaml.
Custom autodiscovery
Selectors used for autodiscovery are completely exposed as configuration entries in the values.yaml file, which means they can be tweaked or replaced to fit almost any environment where the control plane is run as a part of the cluster.
An autodiscovery section looks like the following:
autodiscover: - selector: "tier=control-plane,component=etcd" namespace: kube-system # Set to true to consider only pods sharing the node with the scraper pod. # This should be set to `true` if Kind is Daemonset, `false` otherwise. matchNode: true # Try to reach etcd using the following endpoints. endpoints: - url: https://localhost:4001 insecureSkipVerify: true auth: type: bearer - url: http://localhost:2381 - selector: "k8s-app=etcd-manager-main" namespace: kube-system matchNode: true endpoints: - url: https://localhost:4001 insecureSkipVerify: true auth: type: bearerThe autodiscover section contains a list of autodiscovery entries. Each entry has:
selector: A string-encoded label selector that will be used to look for pods.matchNode: If set to true, it will additionally limit discovery to pods running in the same node as the particular instance of the DaemonSet performing discovery.endpoints: A list of endpoints to try if a pod is found for the specified selector.
Additionally, each endpoint has:
url: URL to target, including scheme. Can behttporhttps.insecureSkipVerify: If set to true, certificate will not be checked forhttpsURLs.auth.type: Which mechanism to use to authenticate the request. Currently, the following methods are supported:- None: If
authis not specified, the request will not contain any authentication whatsoever. bearer: The same bearer token used to authenticate against the Kubernetes API will be sent to this request.mtls: mTLS will be used to perform the request.
mTLS
For the mtls type, the following needs to be specified:
endpoints: - url: https://localhost:4001 auth: type: mtls mtls: secretName: secret-name secretNamespace: secret-namespaceWhere secret-name is the name of a Kubernetes TLS Secret, which lives in secret-namespace, and contains the certificate, key, and CA required to connect to that particular endpoint.
The integration fetches this secret in runtime rather than mounting it, which means it requires an RBAC role granting it access to it. Our Helm Chart automatically detects auth.mtls entries at render time and will automatically create entries for these particular secrets and namespaces for you, unless rbac.create is set to false.
Our integration accepts a secret with the following keys:
cacert: The PEM-encoded CA certificate used to sign thecertcert: The PEM-encoded certificate that will be presented to etcdkey: The PEM-encoded private key corresponding to the certificate above
These certificates should be signed by the same CA etcd is using to operate.
How to generate these certificates is out of the scope of this documentation, as it will vary greatly between different Kubernetes distribution. Please refer to your distribution's documentation to see how to fetch the required etcd peer certificates. In Kubeadm, for example, they can be found in /etc/kubernetes/pki/etcd/peer.{crt,key} in the control plane node.
Once you have located or generated the etcd peer certificates, you should rename the files to match the keys we expect to be present in the secret, and create the secret in the cluster
$mv peer.crt cert$mv peer.key key$mv ca.crt cacert$
$kubectl -n newrelic create secret tls newrelic-etcd-tls-secret --cert=./cert --key=./key --certificate-authority=./cacertFinally, you can input the secret name (newrelic-etcd-tls-secret) and namespace (newrelic) in the config snippet shown at the beginning of this section. Remember that the Helm Chart will automatically parse this config and create an RBAC role to grant access to this specific secret and namespace for the nrk8s-controlplane component, so there's no manual action needed in that regard.
Static endpoints
While autodiscovery should cover cases where the control plane lives inside the Kubernetes clusters, some distributions or sophisticated Kubernetes environments run the control plane elsewhere, for a variety of reasons including availability or resource isolation.
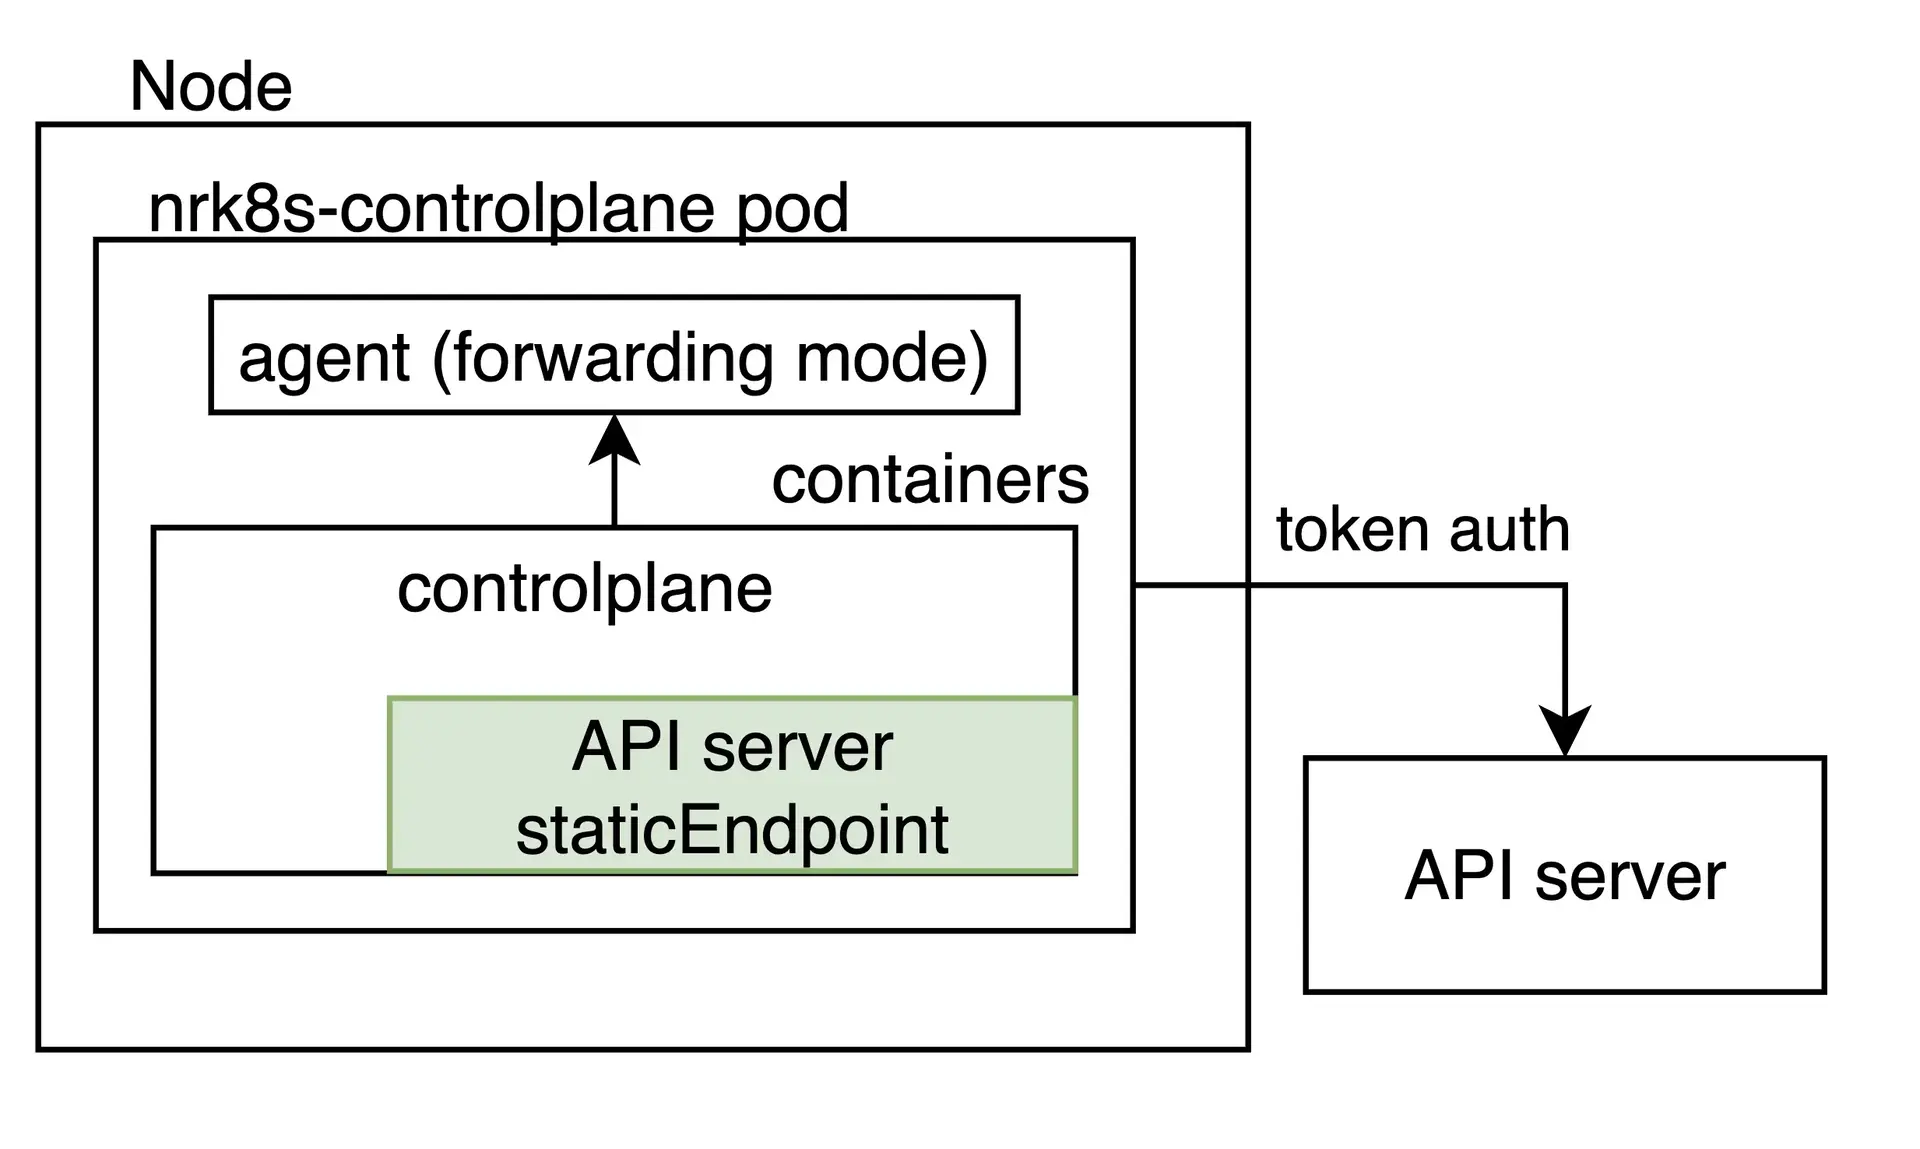
For these cases, the integration can be configured to scrape an arbitrary, fixed URL regardless of whether a pod with a control plane label is found in the node. This is done by specifying a staticEndpoint entry. For example, one for an external etcd instance would look like this:
controlPlane: etcd: staticEndpoint: url: https://url:port insecureSkipVerify: true auth: {}
staticEndpoint is the same type of entry as endpoints in the autodiscover entry, whose fields are described above. The authentication mechanisms and schemas are supported here.
Please keep in mind that if staticEndpoint is set, the autodiscover section will be ignored in its entirety.
Limitations
重要
If you're using staticEndpoint pointing to an out-of-node (for example, not localhost) endpoint, you must change controlPlane.kind from DaemonSet to Deployment.
When using staticEndpoint, all nrk8s-controlplane pods will attempt to reach and scrape said endpoint. This means that, if nrk8s-controlplane is a DaemonSet (the default), all instances of the DaemonSet will scrape this endpoint. While this is fine if you're pointing them to localhost, if the endpoint is not local to the node you could potentially produce to duplicate metrics and increased billable usage. If you're using staticEndpoint and pointing it to a non-local URL, make sure to change controlPlane.kind to Deployment.
For the same reason above, it is currently not possible to use autodiscovery for some control plane components, and a static endpoint for others. This is a known limitation we are working to address in future versions of the integration.
Lastly, staticEndpoint allows only to define a single endpoint per component. This means that if you have multiple control plane shards in different hosts, it is currently not possible to point to them separately. This is also a known limitation we are working to address in future versions. For the time being, a workaround could be to aggregate metrics for different shards elsewhere, and point the staticEndpoint URL to the aggregated output.
Control plane monitoring for managed and cloud environments
Some cloud environments, like EKS or GKE, allow retrieving metrics from the Kubernetes API Server. This can be easily configured as an static endpoint:
controlPlane: affinity: false # https://github.com/helm/helm/issues/9136 kind: Deployment # `hostNetwork` is not required for monitoring API Server on AKS, EKS hostNetwork: false config: etcd: enabled: false scheduler: enabled: false controllerManager: enabled: false apiServer: staticEndpoint: url: "https://kubernetes.default:443" insecureSkipVerify: true auth: type: bearerPlease note that this only applies to the API Server and that etcd, the scheduler, and the controller manager remain inaccessible in cloud environments.
Moreover, be aware that, depending on the specific managed or cloud environment, the Kubernetes service could be loadbalancing the traffic among different instances of the API Server. In this case, the metrics that depends on the specific instance being selected by the loadbalancer are not reliable.
Control plane monitoring for Rancher RKE1
Clusters deployed leveraging Rancher Kubernetes Engine (RKE1) run control plane components as Docker containers, and not as Pods managed by the Kubelet.
That's why the integration can't autodiscover those containers, and every endpoint needs to be manually specified in the staticEndpoint section of the integration configuration.
The integration needs to be able to reach the different endpoints either by connecting directly, with the available authentication methods (service account token, custom mTLS certificates, or none), or through a proxy.
For example, in order to make the Scheduler and the Controller Manager metrics reachable, you might need to add the --authorization-always-allow-paths flag, allowing /metrics or --authentication-kubeconfig and --authorization-kubeconfig to enable token authentication.
Assuming that every component is reachable at the specified port, the following configuration will monitor the API Server, the Scheduler and the Controller Manager:
controlPlane: kind: DaemonSet config: scheduler: enabled: true staticEndpoint: url: https://localhost:10259 insecureSkipVerify: true auth: type: bearer controllerManager: enabled: true staticEndpoint: url: https://localhost:10257 insecureSkipVerify: true auth: type: bearer apiServer: enabled: true staticEndpoint: url: https://localhost:6443 insecureSkipVerify: true auth: type: bearerIn this example, the integration needs to run on the same node of each control plane component that has the hostNetwork option set to true, since it's connecting locally to each staticEndpoint. Therefore, controlPlane.kind has to be kept as DaemonSet. Also, the DaemonSet needs affinity rules, nodeSelector, and tolerations configured so that all instances are running on all control plane nodes you want to monitor.
You can recognize the control plane nodes by checking the node-role.kubernetes.io/controlplane label. This label is already taken into account by the integration default affinity rules.
If you're using version 2 of the integration, see Monitoring control plane with integration version 2.
OpenShift configuration
Version 3 of the Kubernetes integration includes default settings that will autodiscover control plane components in OpenShift clusters, so it should work out of the box for all components except etcd.
Etcd is not supported out of the box as the metrics endpoint is configured to require mTLS authentication in OpenShift environments. Our integration supports mTLS authentication to fetch etcd metrics in this configuration, however you will need to create the required mTLS certificate manually. This is necessary to avoid granting wide permissions to our integration without the explicit approval from the user.
To create an mTLS secret, please follow the steps in this section below, and then configure the integration to use the newly created secret as described in the mtls section.
If you're using version 2 of the integration, OpenShift configuration on Integration version 2.
Set up mTLS for etcd in OpenShift
Follow these instructions to set up mutual TLS authentication for etcd in OpenShift 4.x:
Export the etcd client certificates from the cluster to an opaque secret. In a default managed OpenShift cluster, the secret is named
kube-etcd-client-certsand it is stored in theopenshift-monitoringnamespace.bash$kubectl get secret etcd-client -n openshift-etcd -o yaml > etcd-secret.yamlThe content of the etcd-secret.yaml would look something like the following.
apiVersion: v1data:tls.crt: <CERT VALUE>tls.key: <KEY VALUE>kind: Secretmetadata:creationTimestamp: "2023-03-23T23:19:17Z"name: etcd-clientnamespace: openshift-etcdresourceVersion:uid: xxxxxxxx-xxxx-xxxx-xxxx-xxxxxxxxxxxxtype: kubernetes.io/tlsOptionally, change the secret name and namespace to something meaningful. The next steps assume secret name and namespace are changed to
mysecretandnewrelicrespectively.Remove these unnecessary keys in the metadata section:
creationTimestampresourceVersionuid
Install the manifest with its new name and namespace:
bash$kubectl apply -n newrelic -f etcd-secret.yamlConfigure the integration to use the newly created secret as described in the mtls section. This can be done by adding the following configuration in the
values.yamlif you're installing the integration through thenri-bundlechart.newrelic-infrastructure:controlPlane:enabled: trueconfig:etcd:enabled: trueautodiscover:- selector: "app=etcd,etcd=true,k8s-app=etcd"namespace: openshift-etcdmatchNode: trueendpoints:- url: https://<ETCD_ENDPOINT>:<PORT>insecureSkipVerify: trueauth:type: mTLSmtls:secretName: mysecretsecretNamespace: newrelic
See your data
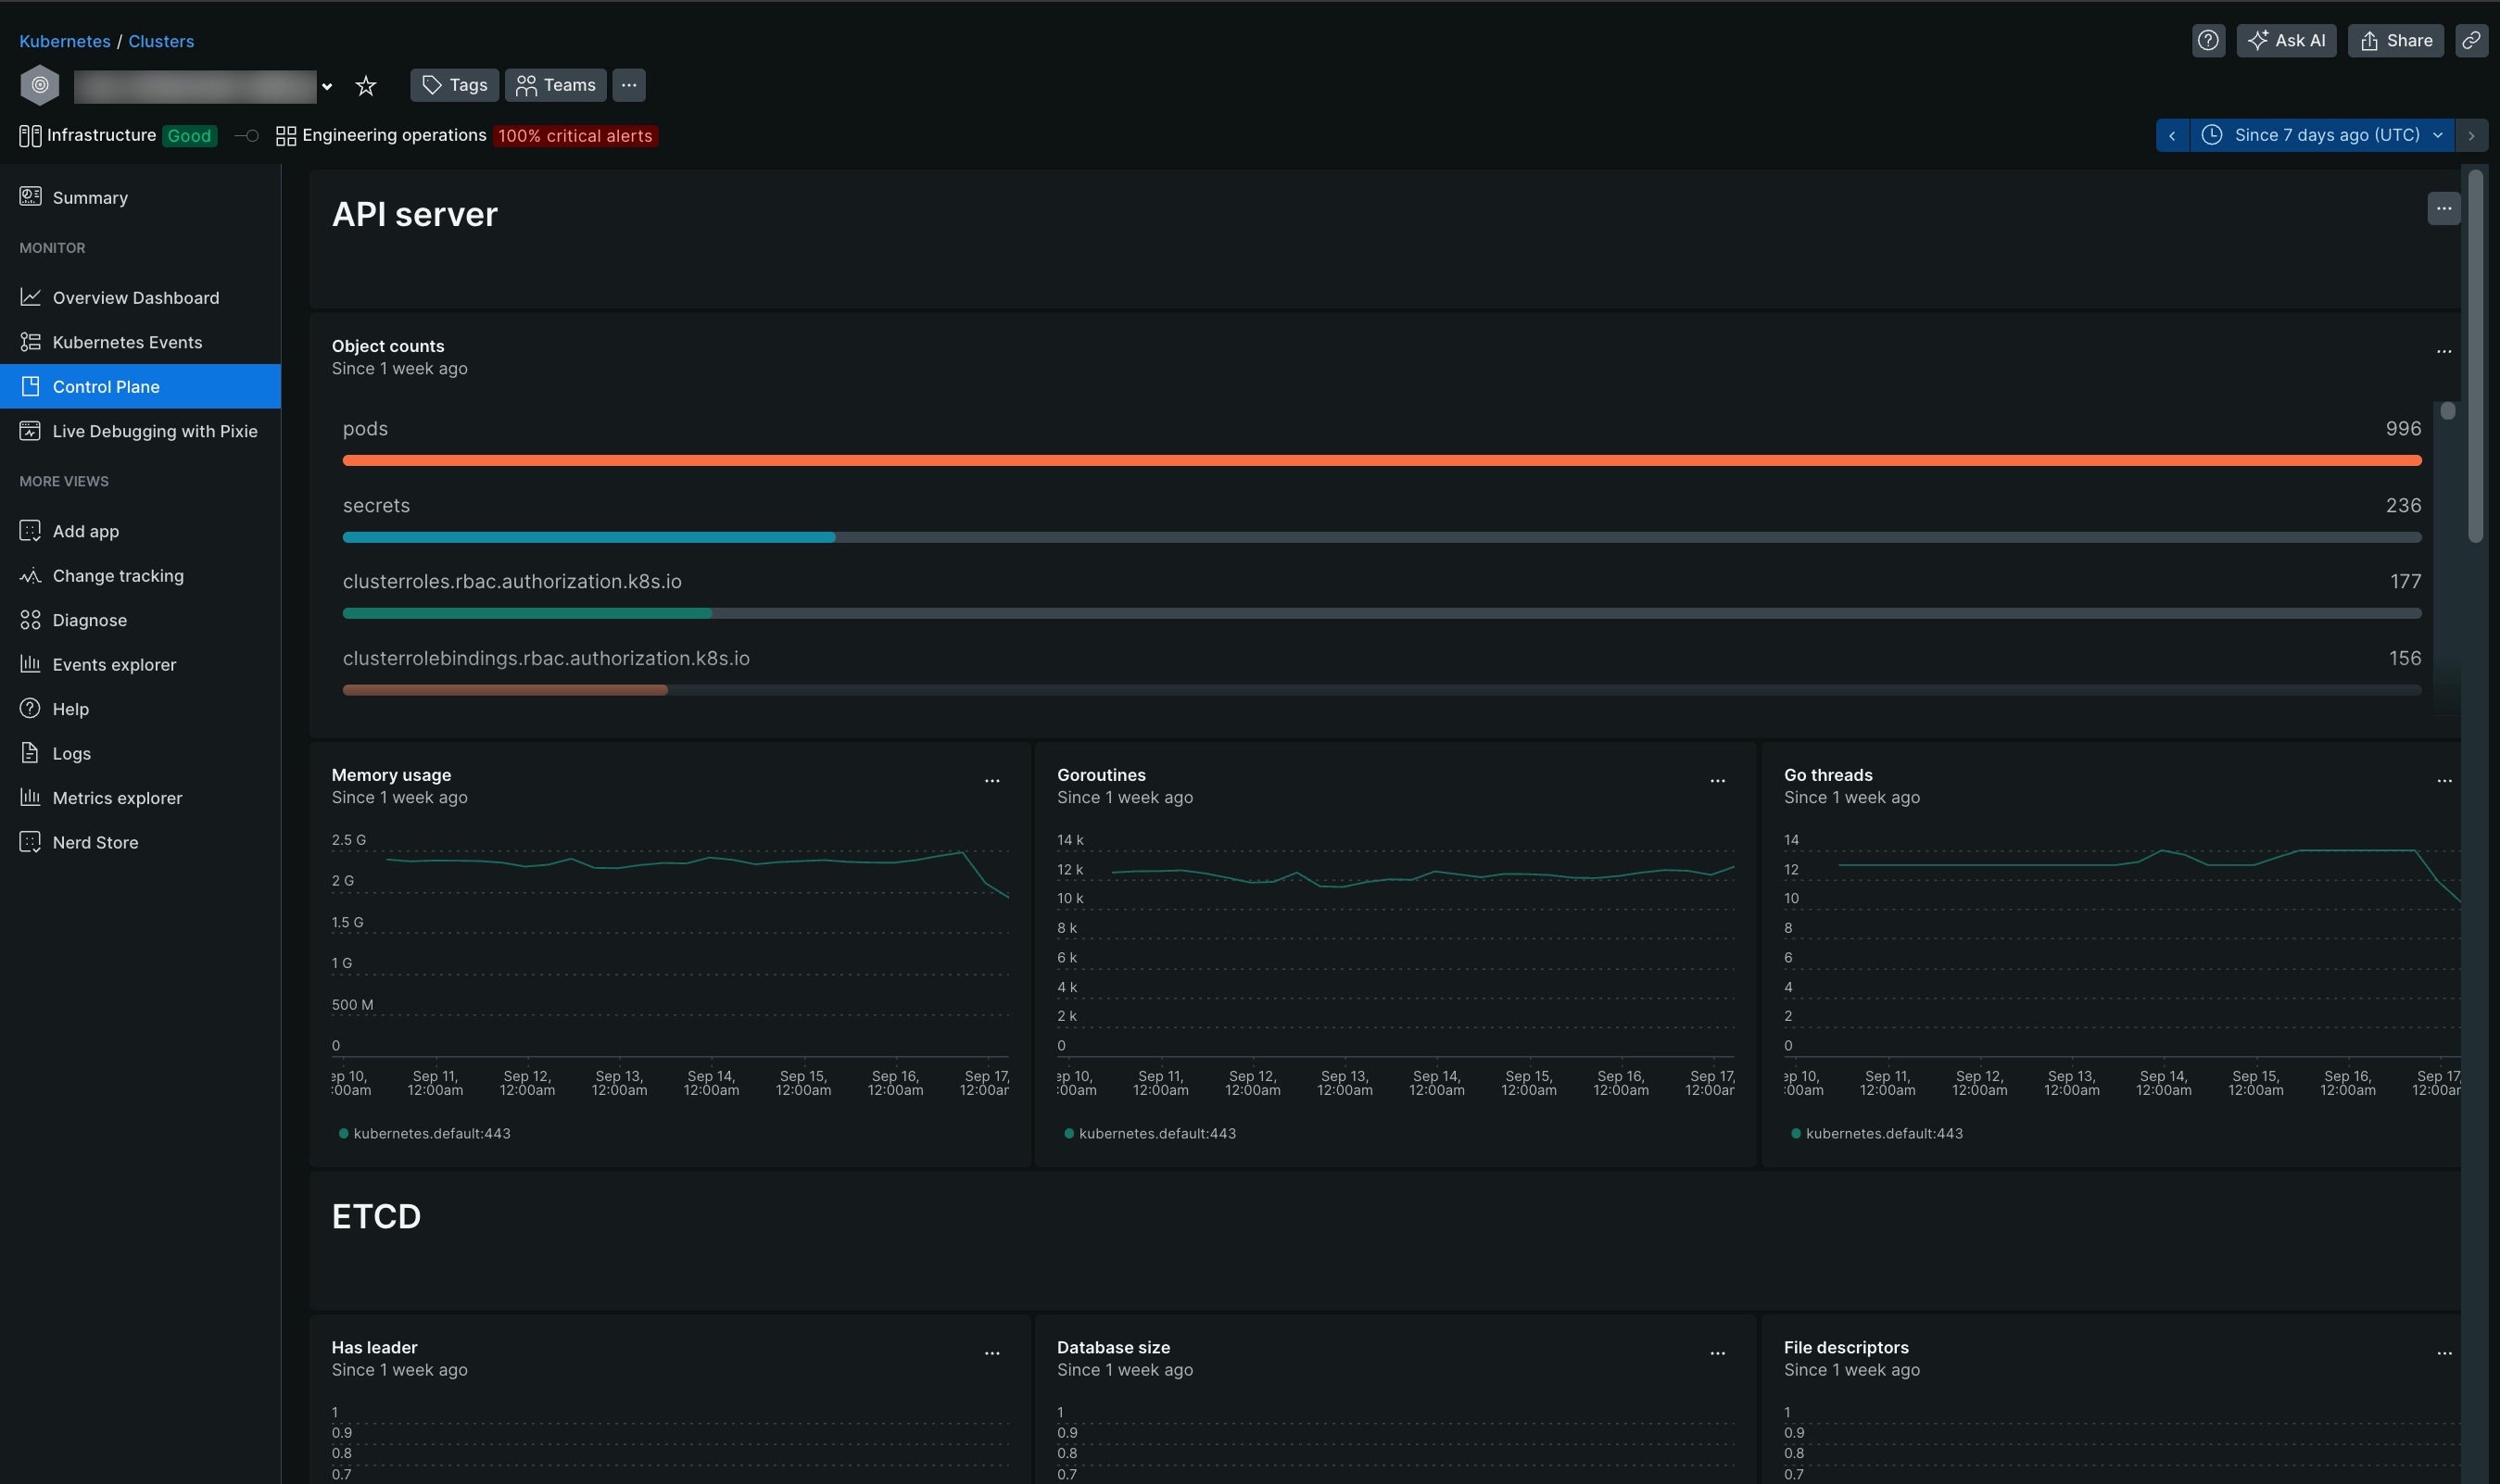
If the integration is set up correctly, you'll see a view with all the control plane components and their statuses in a dedicated section, as shown below.

Go to one.newrelic.com > All capabilities > Kubernetes and click Control plane on the left navigation pane.
You can also check for control plane data with this NRQL query:
SELECT latest(timestamp) FROM K8sApiServerSample, K8sEtcdSample, K8sSchedulerSample, K8sControllerManagerSample FACET entityName WHERE clusterName = '_MY_CLUSTER_NAME_'ヒント
If you still can't see Control Plane data, check out this troubleshooting page.