Our handled exceptions monitoring feature helps you identify significant factors contributing to poor mobile application experience, and use filterable data to find a resolution more quickly. You can also use the handled exceptions API to customize the data you send, and use NRQL to query and share the data.
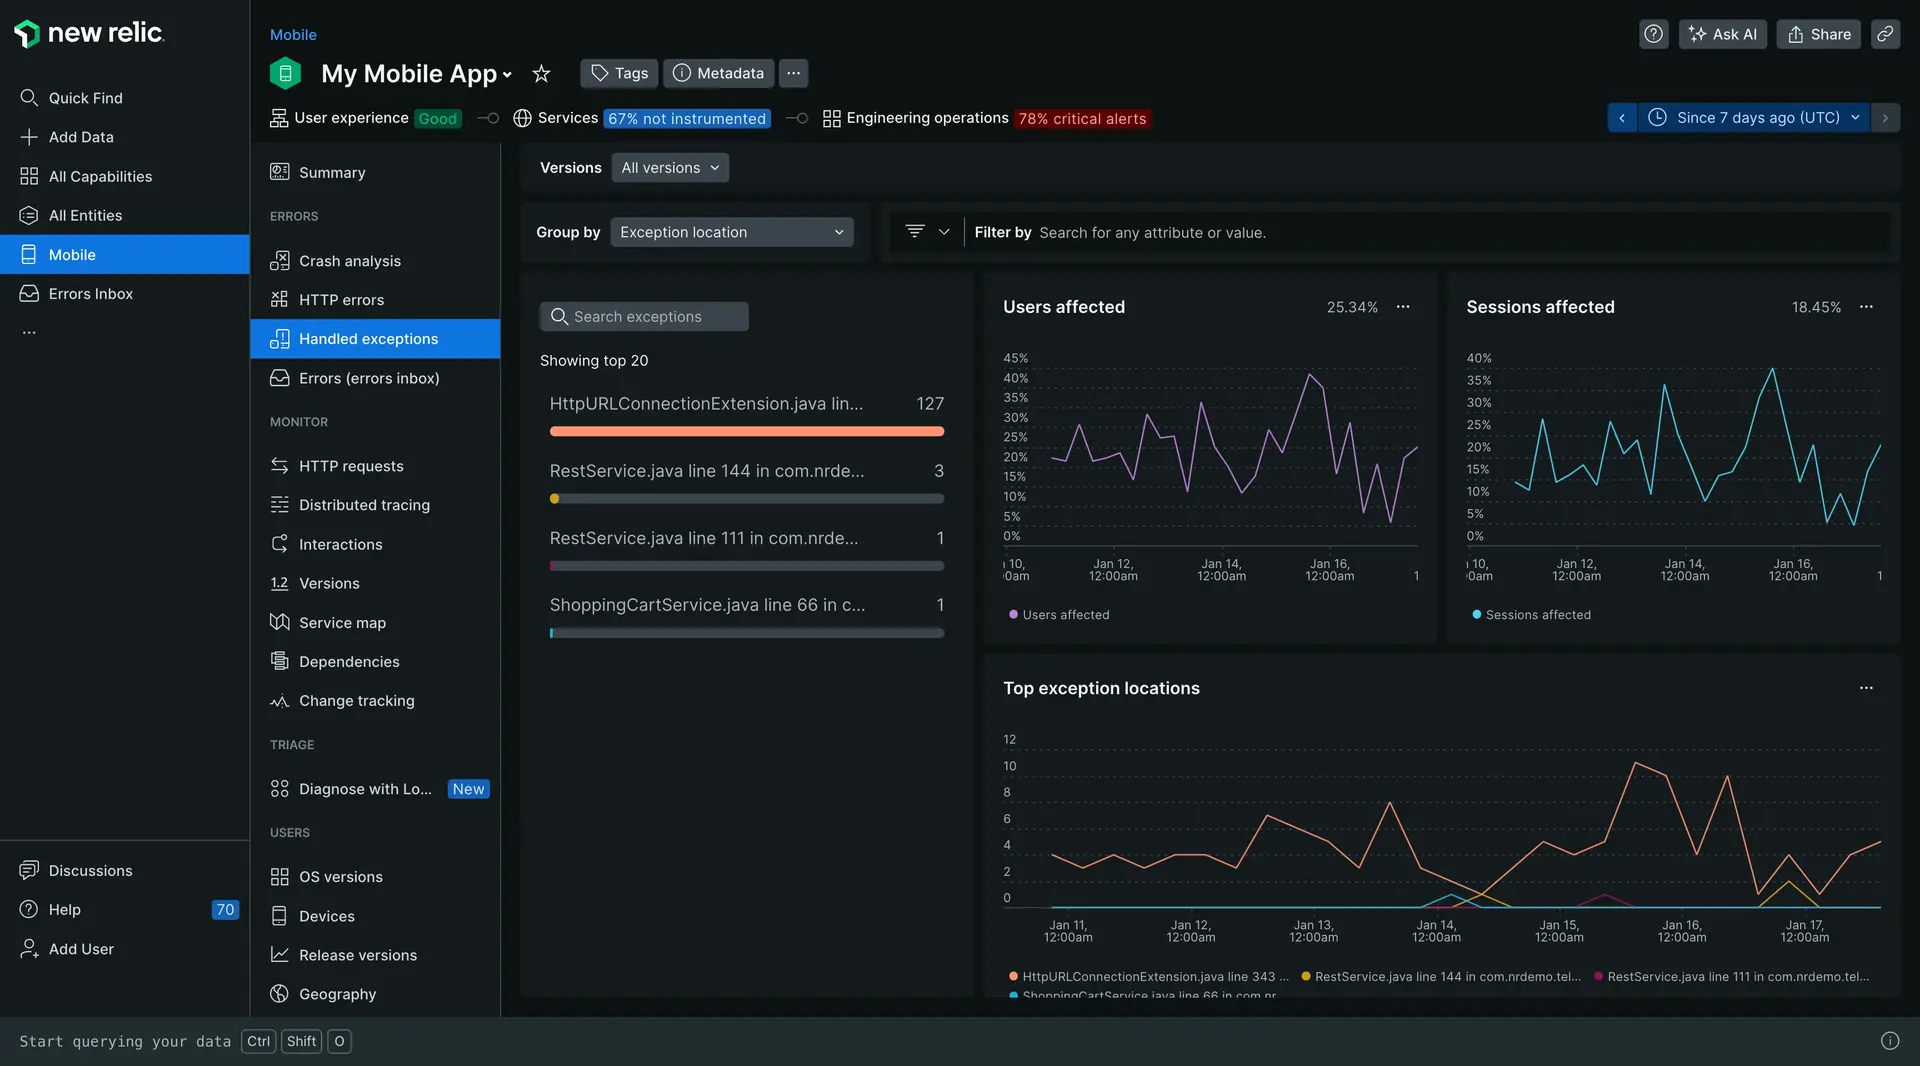
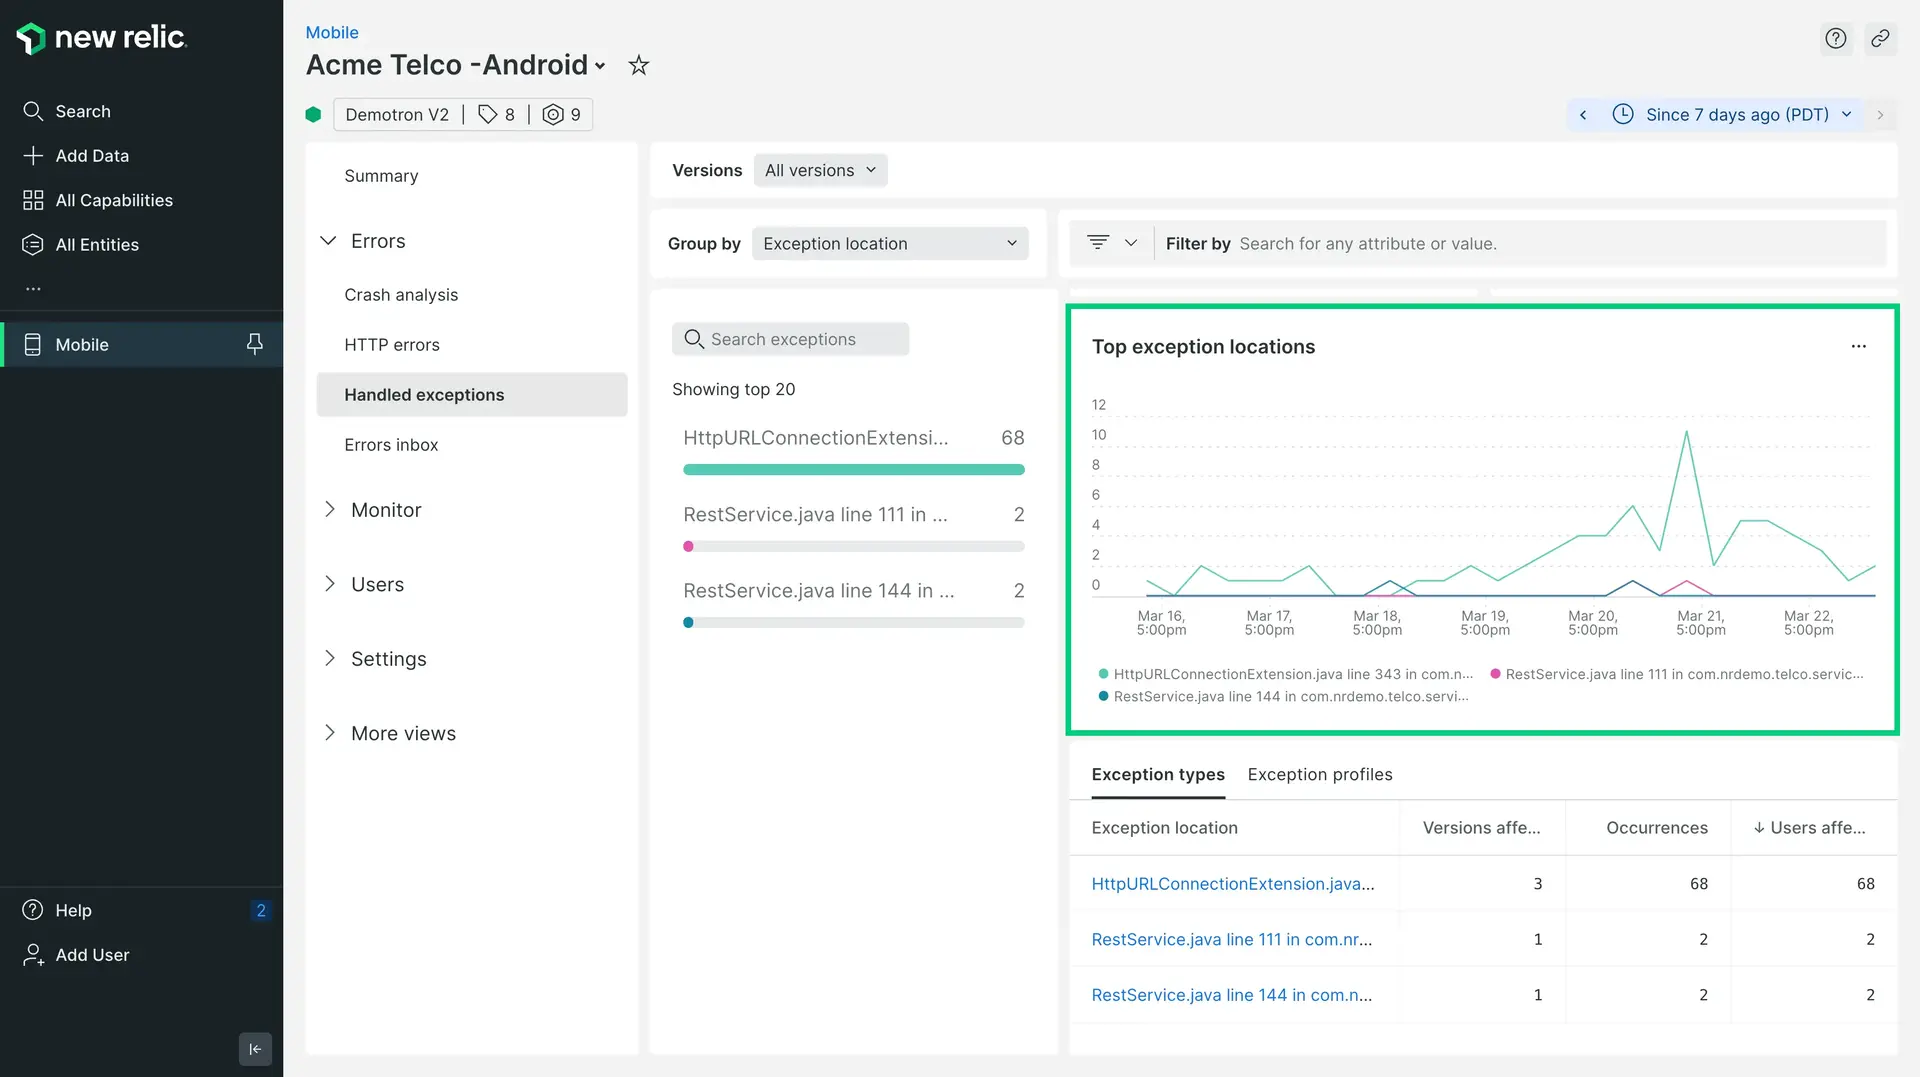
one.newrelic.com > All capabilities > Mobile > (select an app) > Exceptions > Handled exceptions: As you explore the wealth of data in the charts and table, use groups and filters to discover patterns that help you determine the root cause of mobile app exceptions.
Features
Handling exceptions as they occur can help improve your mobile app users' experience, but it's not enough to catch exceptions. You also need to know how to prevent them. Our Handled exceptions feature helps you answer these kinds of questions:
- How many different types of handled exceptions are occurring? A high occurrence rate may indicate you need to make changes to the backend systems.
- Why does the user's app usage result in a try/catch? What is the context for the exceptions?
- When can a test environment's responses to handled exceptions indicate additional, more serious problems?
- What would have caused a crash if the exception had not been caught in production? What else (in the code or backend API) is still affecting the users' experience?
By using handled exceptions, you can identify and resolve these kinds of issues more quickly.
Requirements
To view handled exception data, your app needs to meet these requirements:
Exception percentage charts
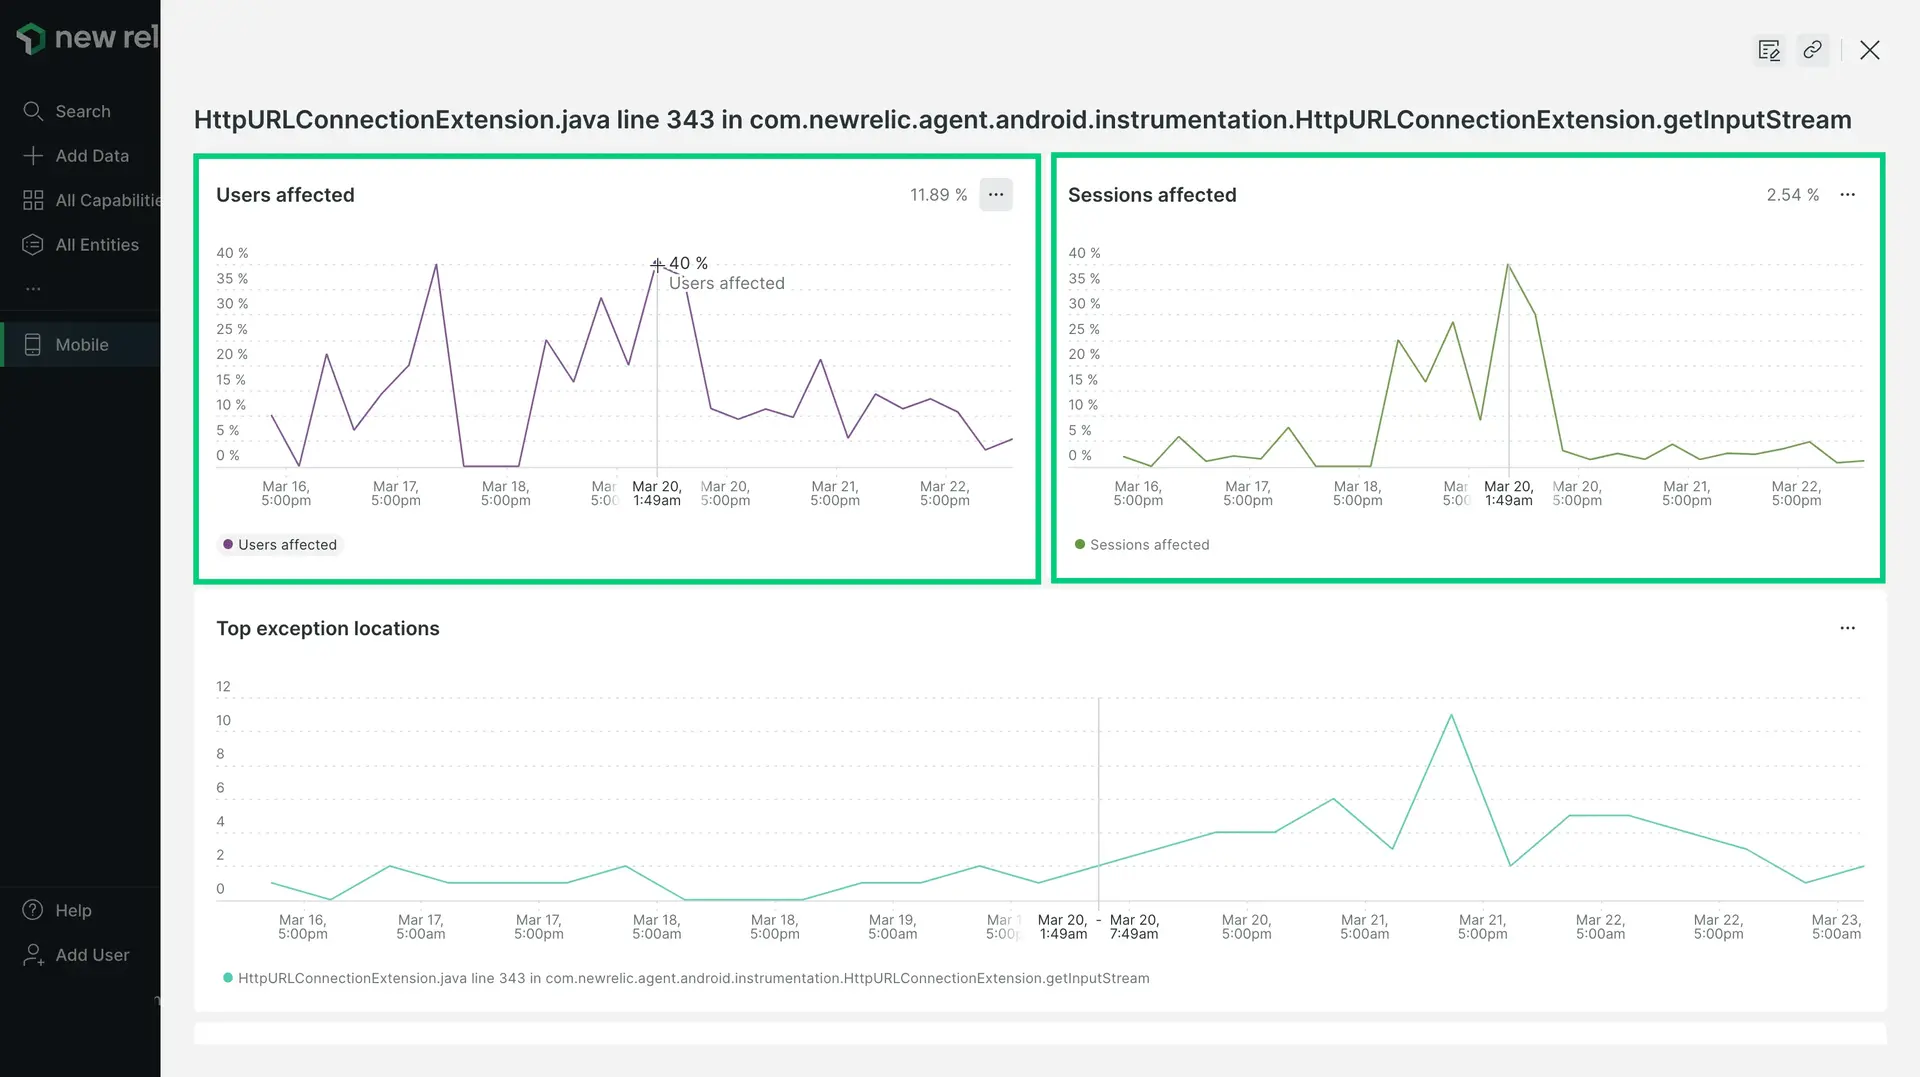
Start with the Users affected and Sessions affected percentage charts to see if there are any unexpected spikes, dips, or patterns with exceptions in general. If the Users affected chart is empty, that means there were no user sessions during the selected time period.
Use this to answer questions like:
- Are there any spikes near a recent version release?
- Is there a time period when the percentage of users has been affected significantly by the exception?
- Are there uneventful periods?
To examine data in greater detail: Below any chart, select Expand chart.
Groups and filters
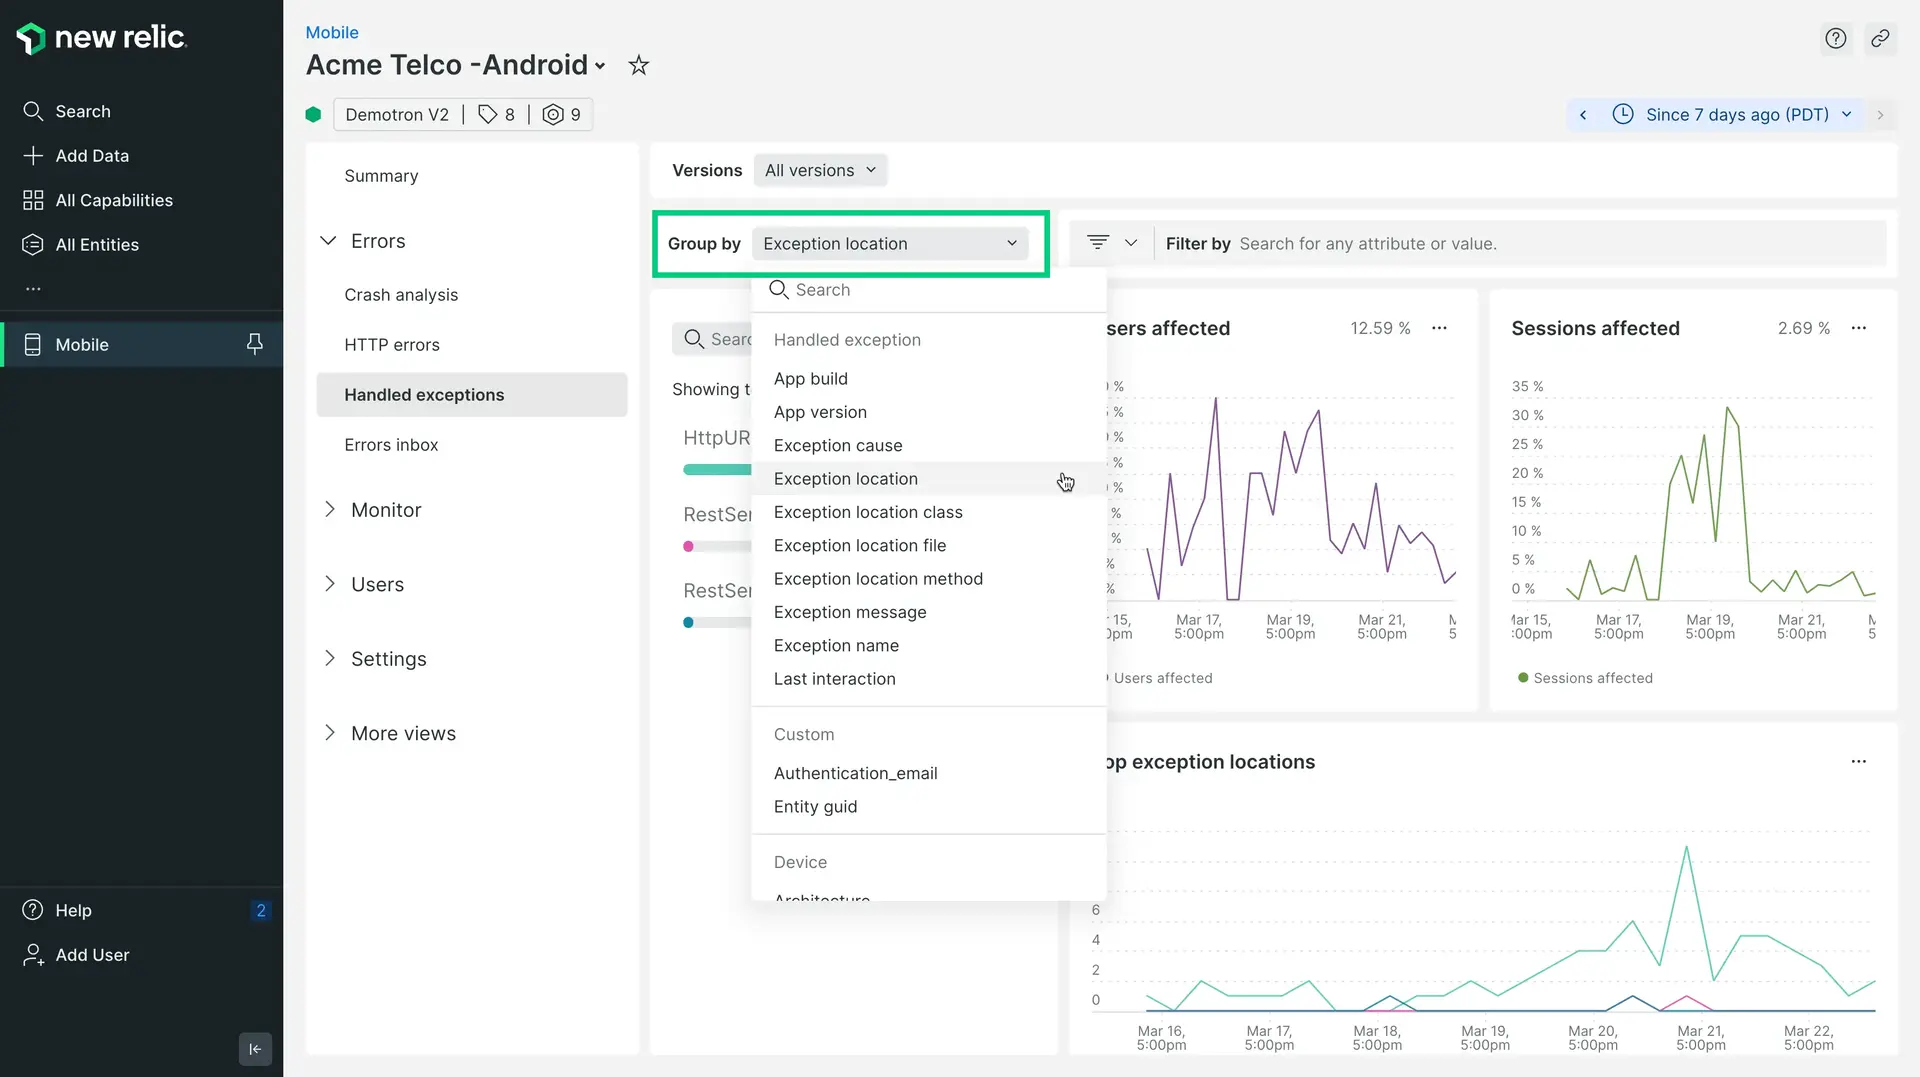
Use the groups and filters to examine attributes for crashes, devices, locations, or other custom attributes in more detail. You can select a group, then filter to specific data. Use this to do things like:
- Group the list by exception location (default), cause, app build or version, devices, connections, or other custom attributes. This lets you discover patterns in your exceptions to determine the root cause.
- Use the time picker to adjust the currently selected time period.
- Filter by a specific Version or by one or more attribute Filter, such as
appVersion,exceptionLocationMethod,lastInteraction, or any of the longer list of standard and custom attributes.
The currently selected filters appear at the top of the UI page. You can close them, add other filters, or select other groups and filters.
Top exception locations
Use the Top exception locations table to find or sort patterns in the type of exception you selected from the groups and filters. This includes:
- Recurring locations in the stack trace
- Mobile app version
- Number of occurrences
- Number of users affected during the selected time period
For example, you can group by Exception Message, filter to timeout message, then select individual timeout locations from the table to review the stack trace thread and details about each occurrence.
- To filter or group by other attributes, use the table's search window, or select any of the available filters. For example, filter by type of occurrence, device, a specific location, or any custom attributes.
- To look for other historical patterns, change the selected time period.
Query builder links
Handled exceptions charts use default attributes for mobile events (including MobileHandledException), along with any custom attributes you have added to this event type. When you mouse over the charts, direct links appear below them. These links to the query builder allow you to analyze your mobile app data even deeper.
- View query link: View the NRQL query used to calculate the chart data.
- View in query builder link: View the chart, and share it with others.
Exception locations table
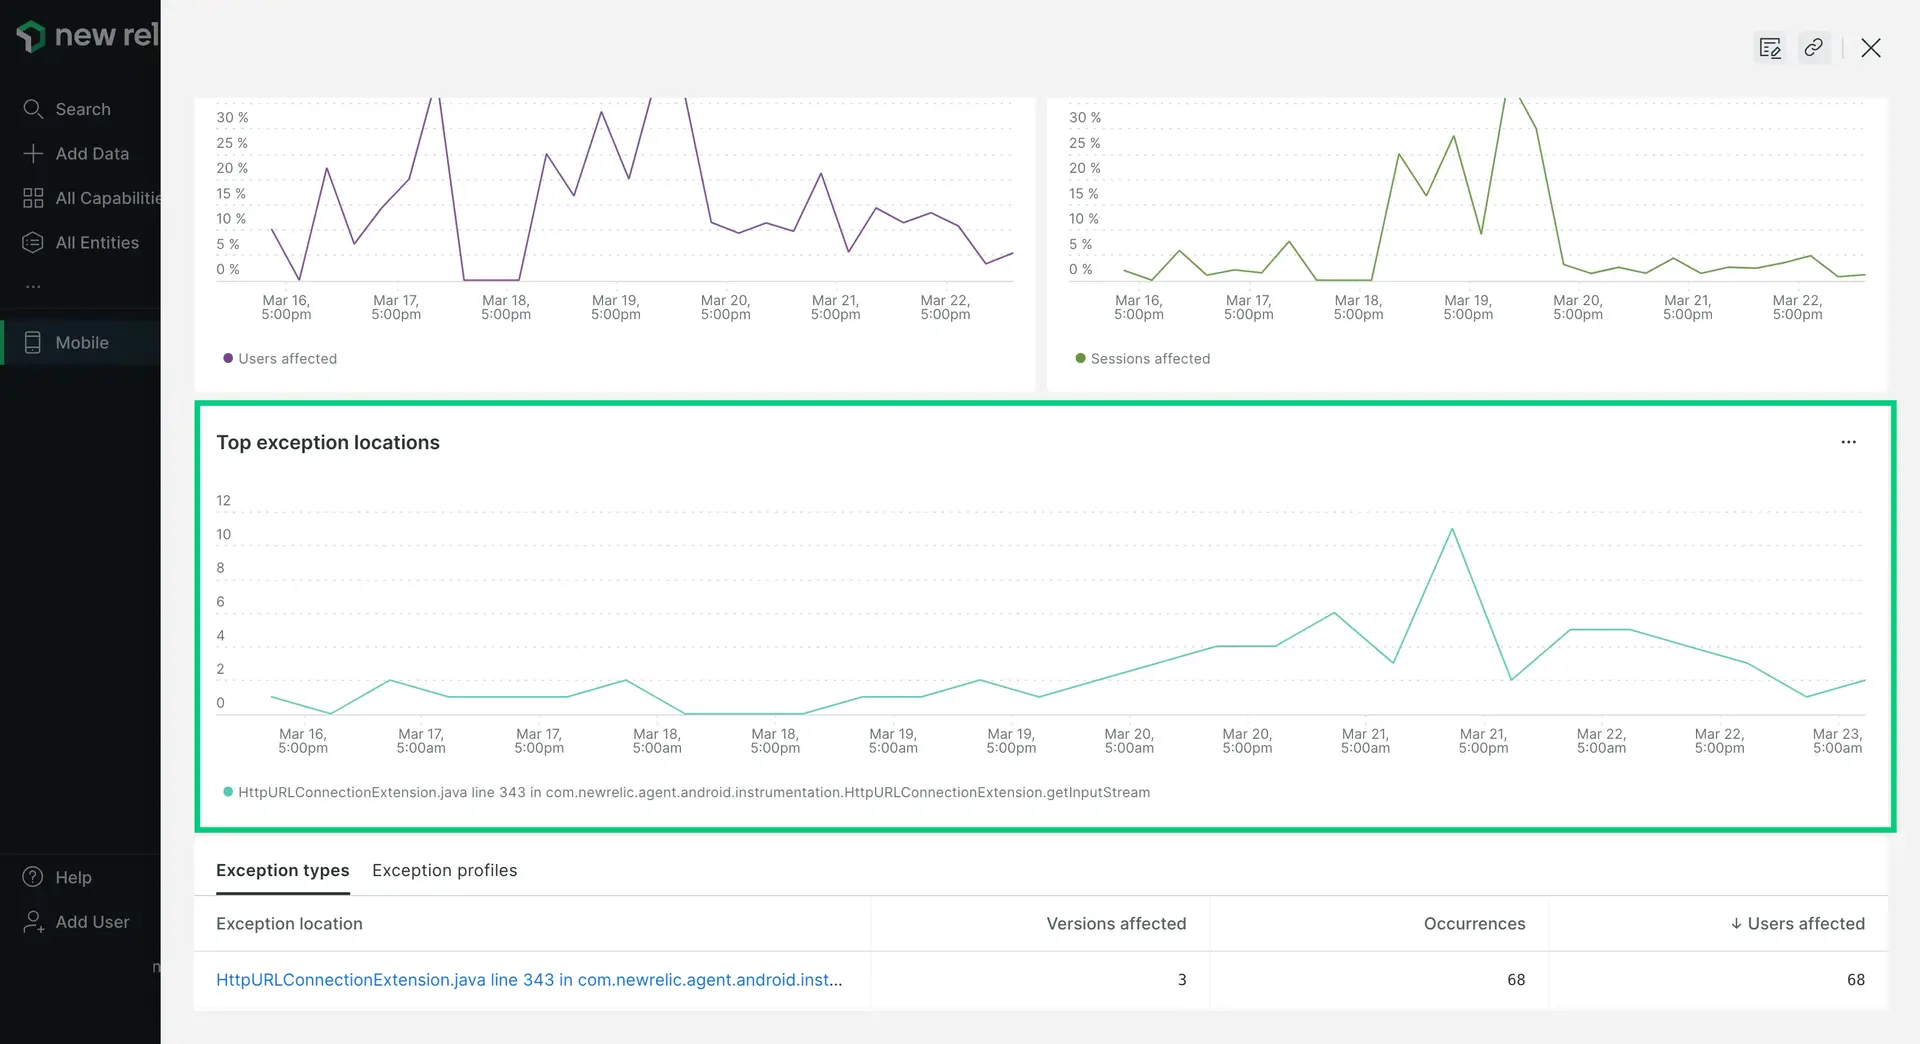
The Exception locations table supplements the charts. It lists where the top five handled exceptions appear in their stack trace thread, and links them to relevant details. Each row helps you find answers to questions such as:
- How many of this exception occurred within the selected time period?
- Does a specific app version have a higher (or lower) number of users affected?
- Which exception has the fewest number of occurrences?
You can change the sort order or filter options to focus on just the types of exceptions that matter the most to you and your teams. To view additional thread details for each occurrence of the exception, select a record from the Top exceptions location table.
Handled exception occurrence details
To view details for each occurrence of a handled exception:
- Go to one.newrelic.com > All capabilities > Mobile > (select an app) > Exceptions > Handled exceptions.
- From the Top exception locations table, select a handled exception on any row.
The Occurrences page shows details about the selected exception, including breakdown data by device type or operating system, number of users affected, total occurrences for the selected time period, attributes, and more.
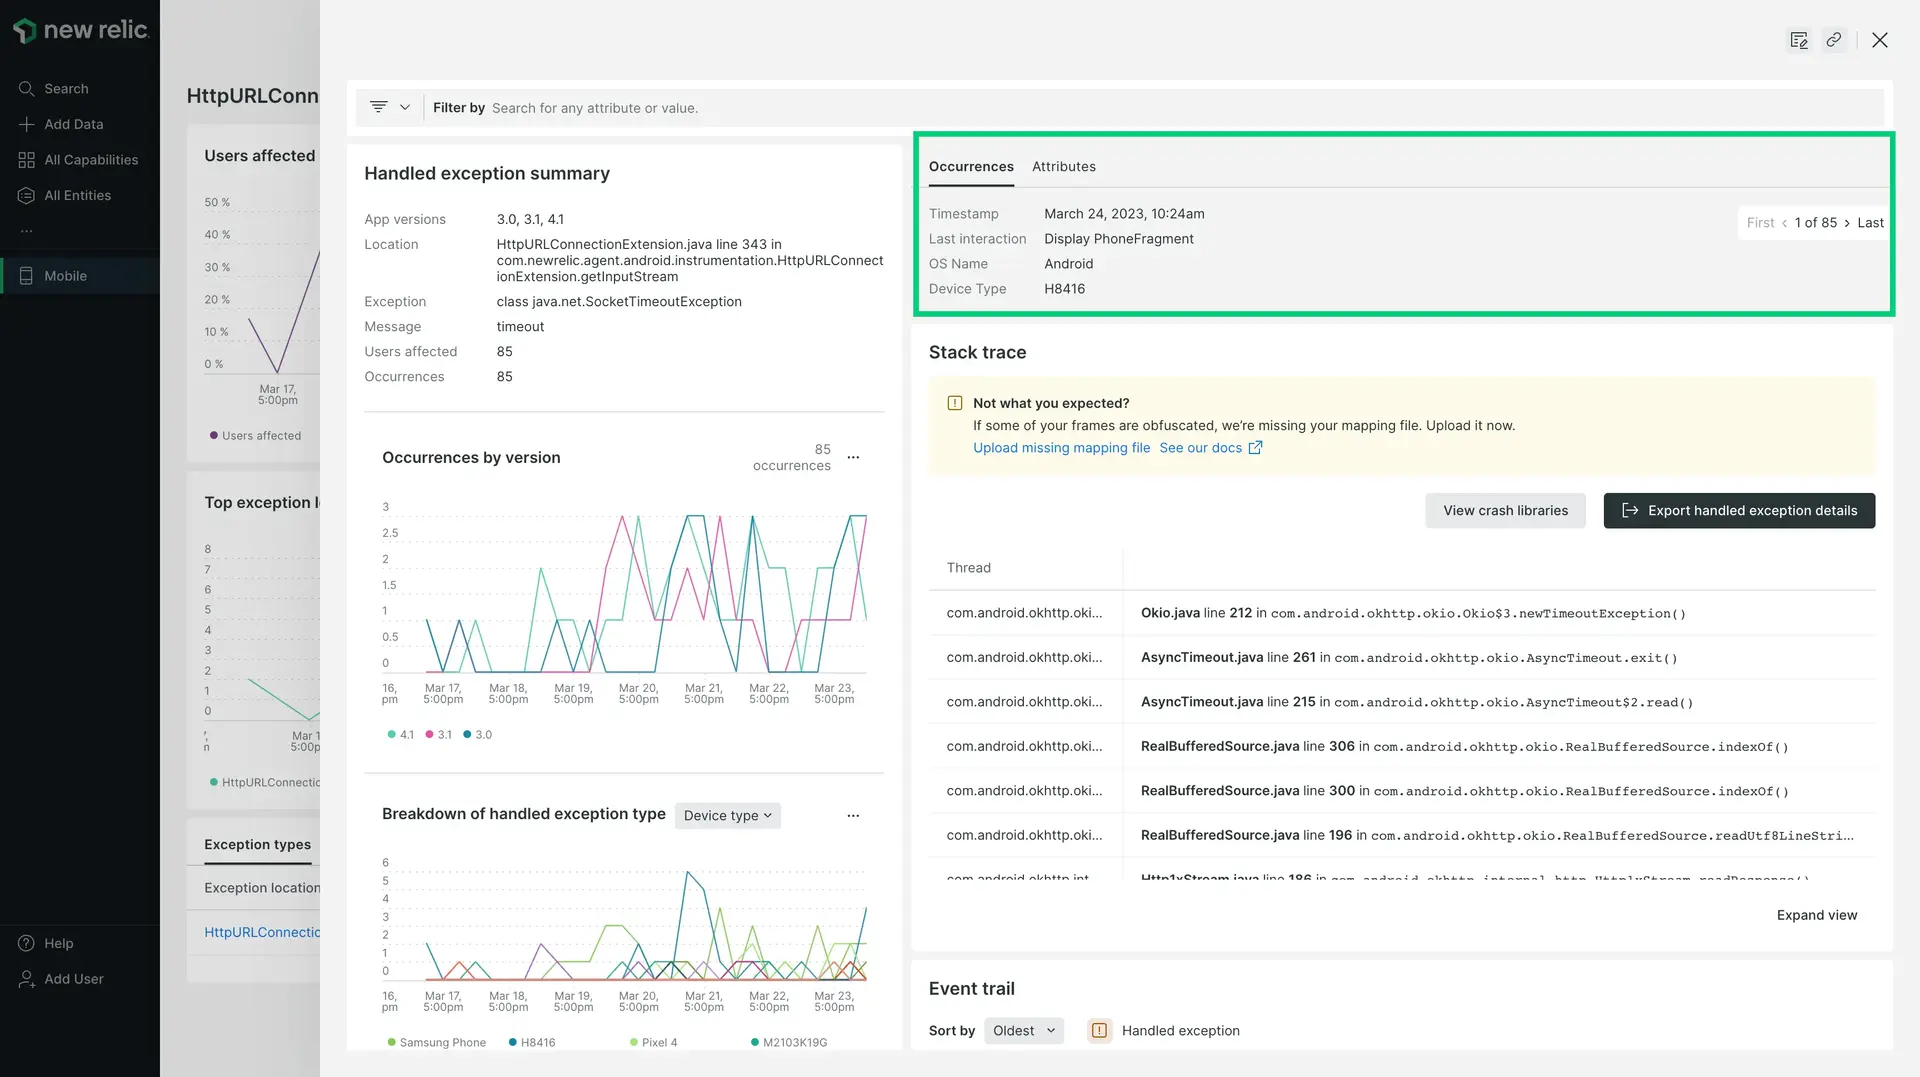
one.newrelic.com > All capabilities > Mobile > (select an app) > Exceptions > Handled exceptions > (select an exception) > Occurrences: Use the thread details to further examine patterns in the stack trace for a handled exception.
If you want to... | Do this |
|---|---|
Find general patterns | From the Occurrences page:
|
Find more specific patterns | Do any of the following:
|
Find patterns from attributes | Review the lists of
|
Query or visualize the occurrence data | Use New Relic to query the data or to create dashboards that you can view or share. |
Event trails for an occurrence
The Event trail chart allows you to see timestamped events leading up to a handled exception.
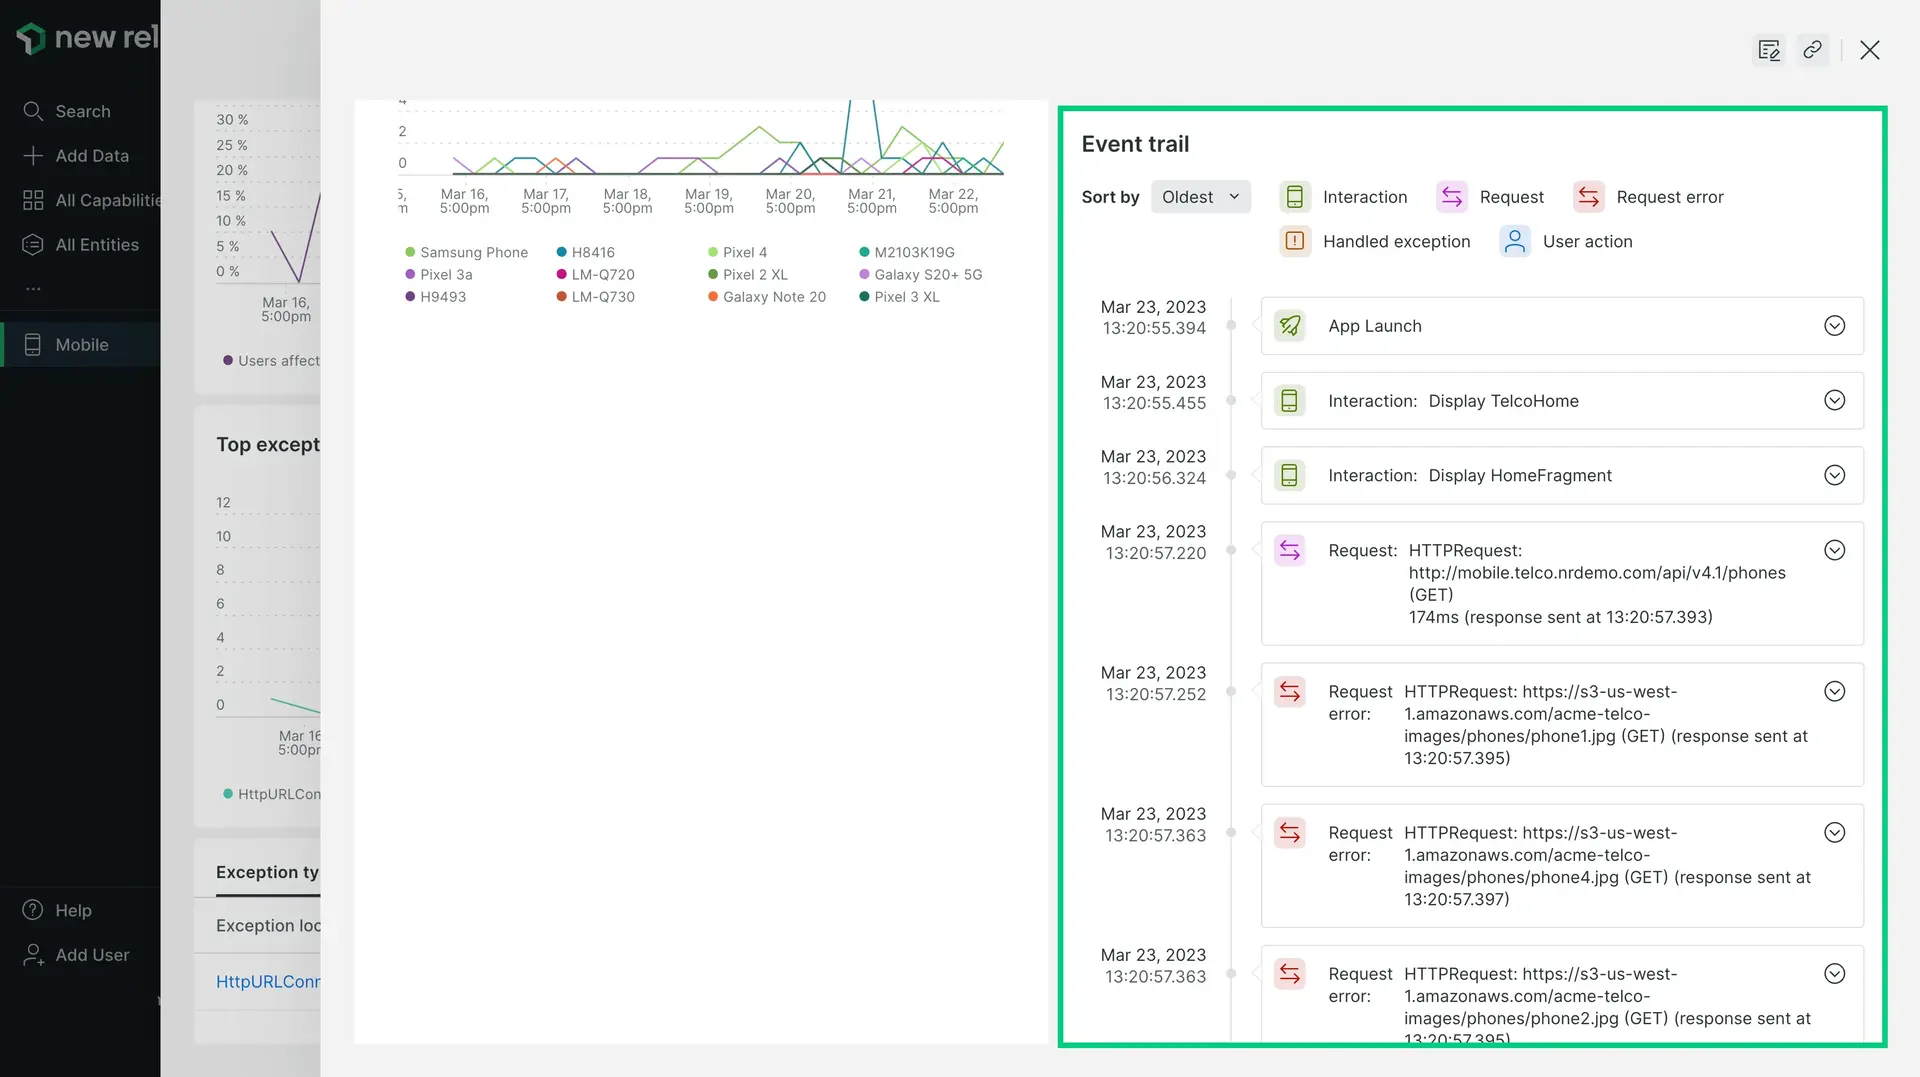
one.newrelic.com > All capabilities > Mobile > (select an app) > Exceptions > Handled exceptions > (click an exception) > (scroll down to Event trail chart): View the event trail for events leading up to a handled exception.
Unsymbolicated stack traces
New Relic does not store unsymbolicated stack traces for handled exceptions. This is different than the crash event trail. You can upload a dSYM later as needed, as new handled exceptions will become symbolicated.
Handled exceptions API
Our Handled exceptions feature automatically includes default attributes that you can use to explore your handled exceptions data in the query builder and get specific details:
- Use the
recordHandledExceptions()method. - Query the
MobileHandledExceptionevent type. For more information, see the NRQL examples for .
Create custom attributes and events
You can also custom attributes and custom events. Once you create them, select and query the attributes on the Handled exceptions page.
