In the dynamic realm of mobile app development, GraphQL enables developers to build powerful and streamlined data fetching tools. However, with the increasing complexity of GraphQL queries and the intricacies of mobile app architecture, the need for comprehensive monitoring has become even more important. New Relic can help you monitor GraphQL requests so you can:
- Identify and optimize queries that are causing delays or performance slowdowns.
- Proactively catch errors before they impact users.
- Ensure data loads quickly and smoothly from end-user requests.

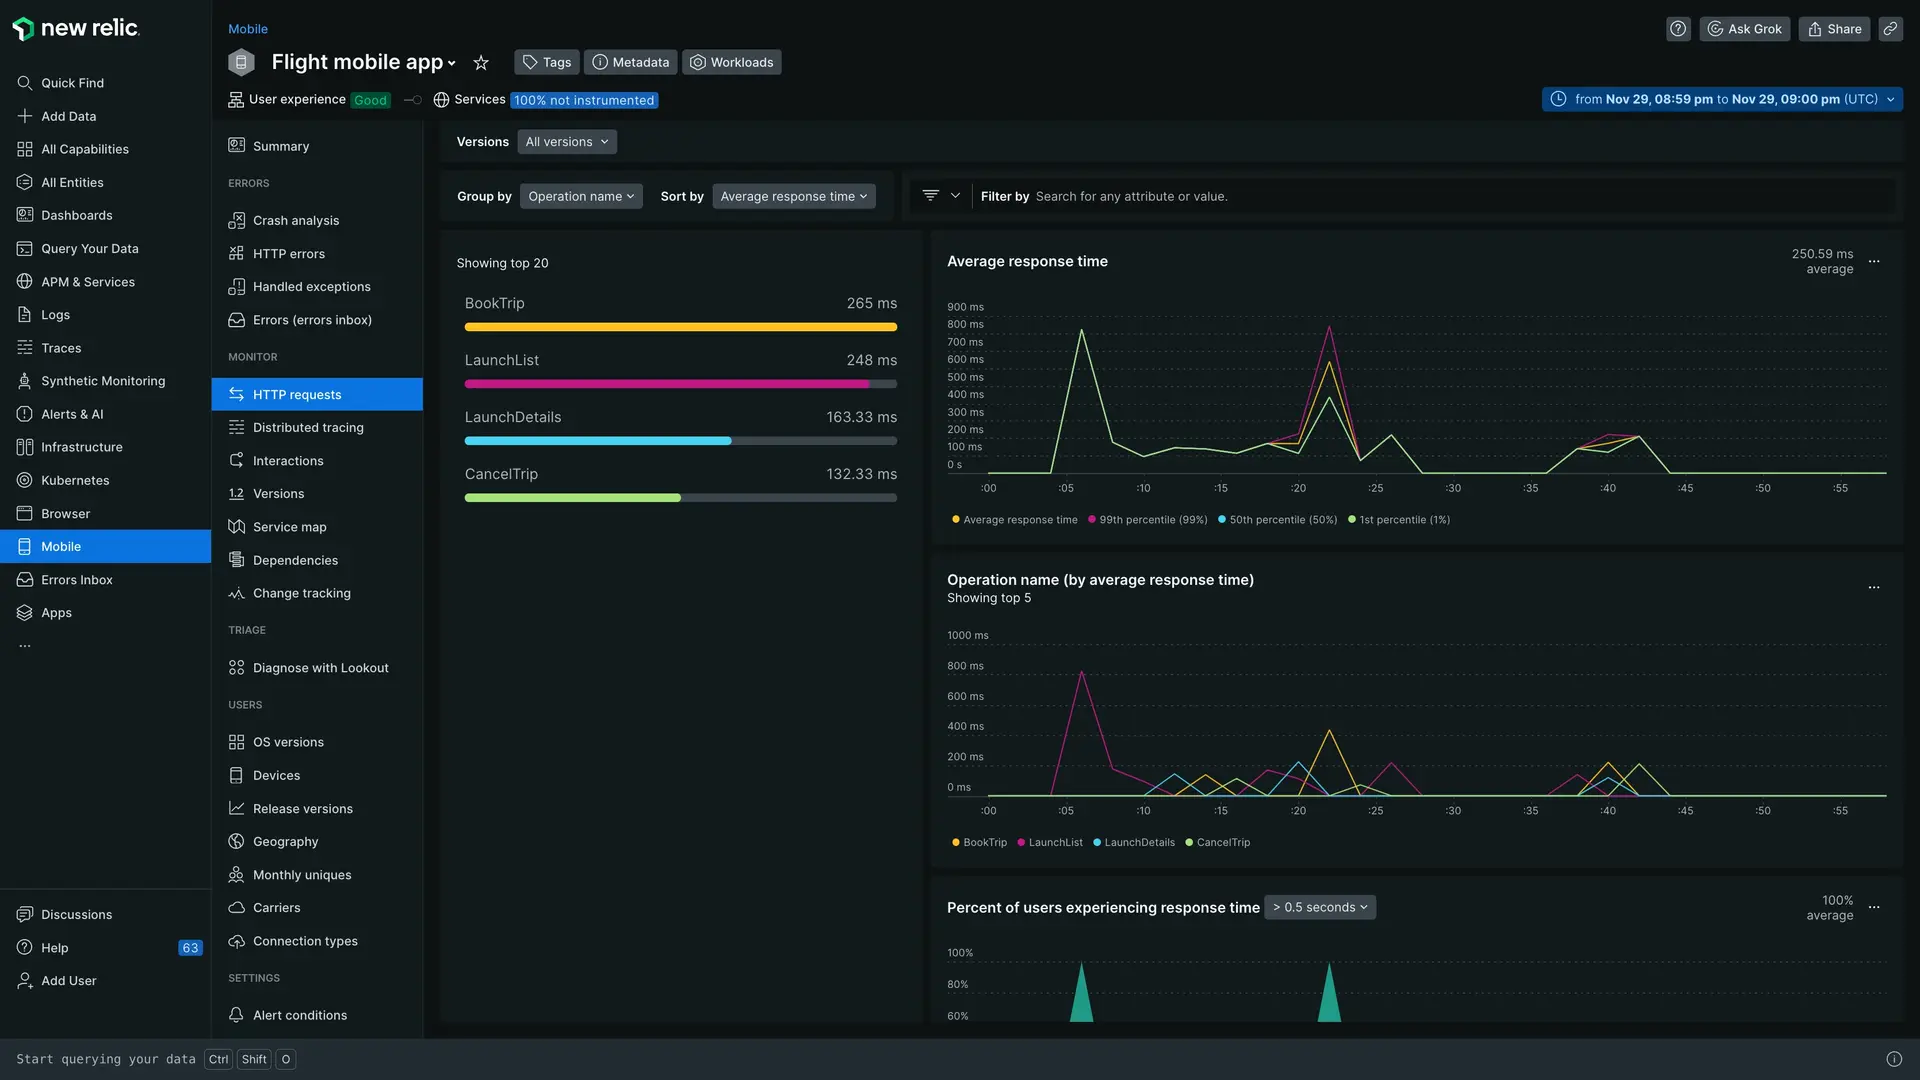
one.newrelic.com > All capabilities > Mobile > (select an app) > HTTP requests: View your GraphQL requests based on the custom name of their function.
Get started
New Relic seamlessly monitors all your GraphQL requests by default. However, for enhanced clarity and analysis, we recommend manually configuring the names of your GraphQL requests. This allows you to categorize requests based on their functionality and view performance data for specific groups of requests.
Unlike REST APIs, where each endpoint serves a distinct purpose, all GraphQL requests are directed to a single /graphql endpoint. This makes it challenging to distinguish between requests that perform different actions. By assigning custom names to your requests, you can gain a clearer understanding of how your GraphQL API is being used and identify potential performance bottlenecks associated with specific request functions.
To custom name your GraphQL requests, you'll need to:
Identify the network request URL. For example, this could be a request related to a customer checkout process with the URL
https://www.YOUR_MOBILE_APP.com/checkout.Use the
addHTTPHeaderTracking methodto set theX-APOLLO-OPERATION-NAMEheader for the identified request. For example, requests related to the customer checkout process could be namedcheckout. The name must meet the following requirements:- Length: Be a string between 1 and 1024 characters.
- Characters: Consist exclusively of ASCII characters.
Follow the platform-specific instructions below:
View data in New Relic
To view your GraphQL requests:
- Go to one.newrelic.com > All capabilities > Mobile.
- Select your mobile app.
- On the left-hand menu, click HTTP requests.
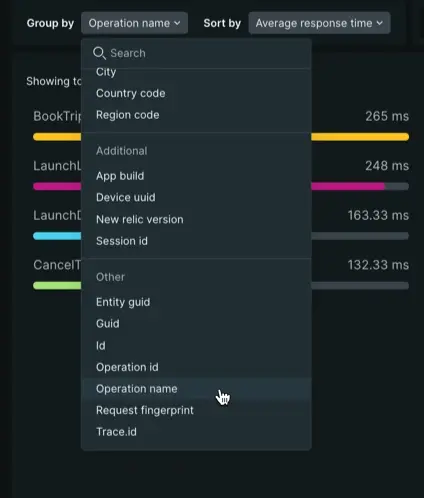
- In the Group by dropdown, select Operation Name. The HTTP requests page will show all your requests grouped by the
operationNameyou set.

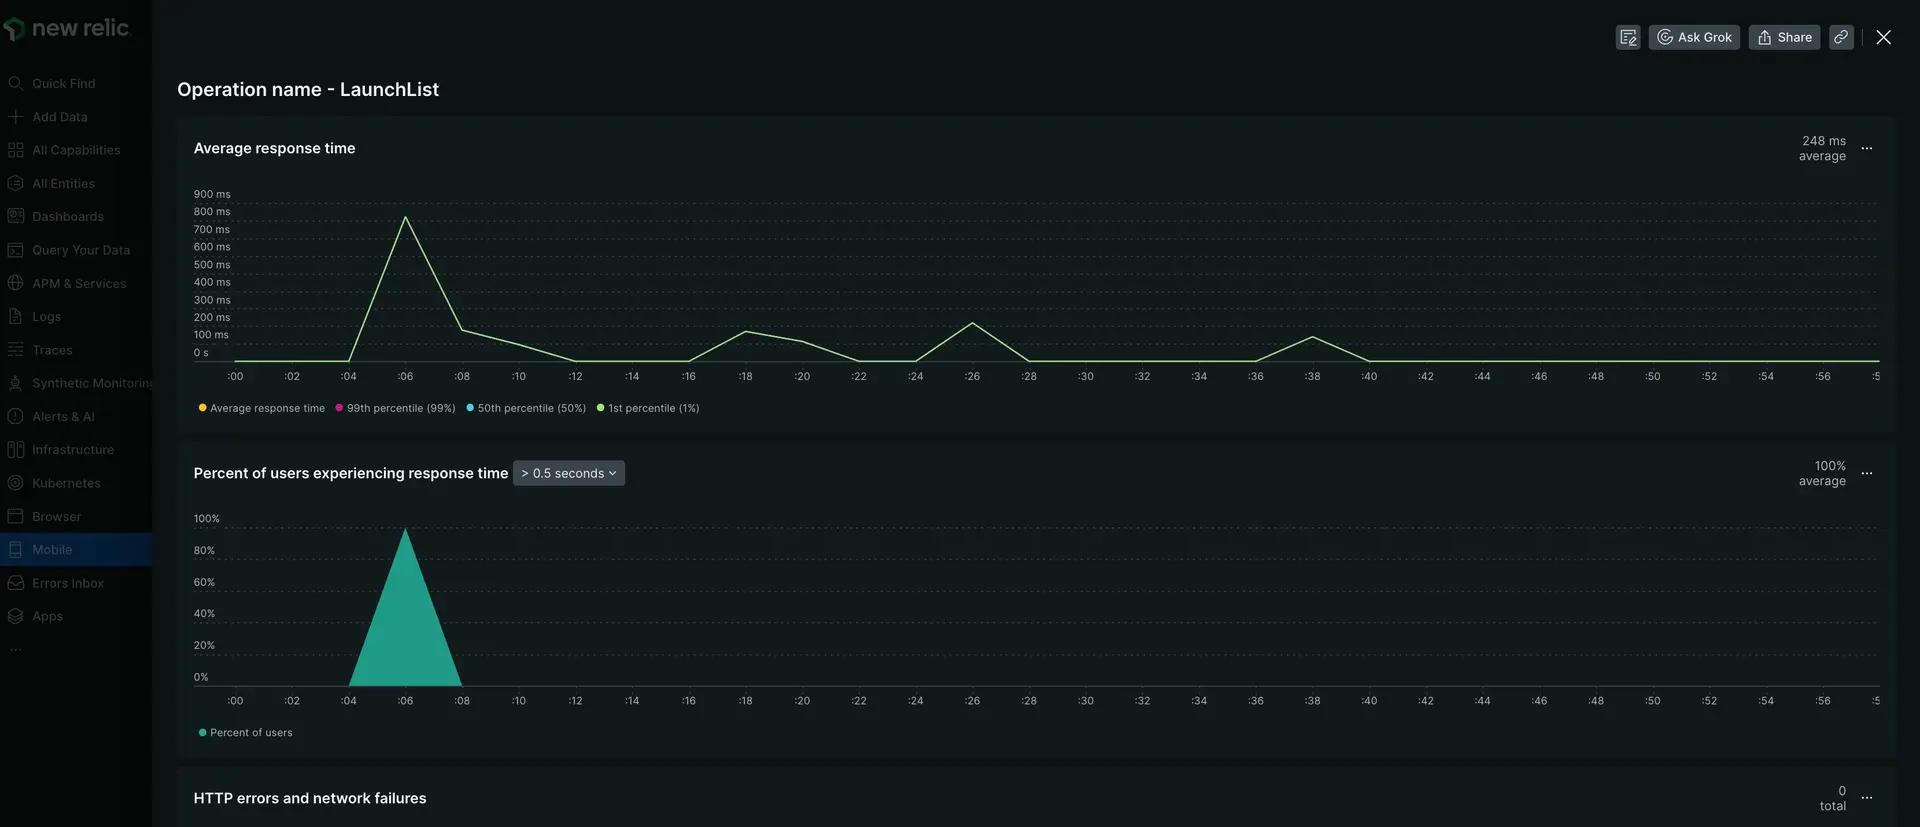
Now that you're looking at just your GraphQL requests, click into a specific request to see metrics on response time and network failure.
