This is the fourth and final part of our implementation guide.
In previous implementation stages, you instrumented your stack and became acquainted with the New Relic platform. Now is a good time to think about proactive solutions that will notify you of problems early and help you avoid worst-case scenarios. In this stage, you'll learn about some important solutions in this area, including:
- Alerting
- Synthetic monitors
- Errors inbox
Think about your alerting strategy
The New Relic UI gives you a view of the state of alert conditions in an account.
Before setting up alerts, we recommend spending some time thinking about your alerting goals and strategy. The larger your organization is, the more important that is.
When you don't have an alerting strategy, and instead set up alerts quickly and haphazardly to solve one-off problems, that can result in too many alert notifications going out. When that happens, your team will suffer from alert fatigue and start to ignore alerts. Spending some time thinking about your alerting strategy will ensure you set up alerts in a smart way that can scale as your organization grows or as you add more data to New Relic.
To route alert notification messages to you, we use workflows (the rules of how incidents create notifications and what data gets sent) and notification destinations (where notifications are sent). We recommend you plan out how these will be set up to be consistent and maintainable across your organization. If you're integrating with another service, such as Slack or PagerDuty, then consider how you'll control and maintain these integrations in the long term.
Avoiding alert fatigue should be a central goal of your alerting strategy. One strategy you could apply is to categorize your alerts by severity of business impact. Those that are more severe or critical should make the loudest noise and be delivered to the stakeholders that are in a position to respond, while those that are less business-impacting should deliver more quietly, with a smaller "blast radius."
For example, you might consider defining some alert severity protocols that you can apply across the organization and use workflows to ensure the alerts are routed correctly. Teams may apply slightly different routing for each severity, but introducing a common language and understanding of impact across the organization can pay dividends as your alerting efforts scale out.
Severity | Impact | Audience | Integrations |
|---|---|---|---|
Sev 1 / P1 | Critical | On call SRE, C-Level Manager / Incident Commander /, Relevant Product Owner and DevOps teams | Pagerduty, Slack, Email |
Sev 2 / P2 | High | Relevant Product Owner and DevOps teams | Pagerduty, Slack |
Sev 3 / P3 | Medium | DevOps teams | Slack |
Sandbox / Sev 4 / P4 | Low / None | DevOps teams | Sandbox Slack |
An example of how an organization might define some alert security protocols.
In order to ensure the long-term quality of alerts, you may want to consider planning regular reviews of your alert conditions to ensure that any alert fatigue is addressed and that alerts are being correctly categorized. This will involve analyzing how often alerts fire and what the response and resolution times are.
For ways to get started with alerting:
- To get started quickly with setting up an alert condition and a notification destination, see our docs on creating your first alert.
- For in-depth guidance on planning out and implementing an alerting strategy, see our Alert quality management guide.
Here are some docs on automating your alerts:
Synthetic monitoring
Our synthetic monitoring gives you a suite of automated, scriptable tools to monitor your websites, critical business transactions, and API endpoints. These tools let you run simple monitors to check on uptime and basic functionality, or create complex scripts that mimic the actions and workflows of real users.
To use synthetics well, your team should identify business-critical customer journeys and dependent APIs, and set up synthetic monitors to track them. Your synthetic monitor reports can be part of your workloads or other dashboards.

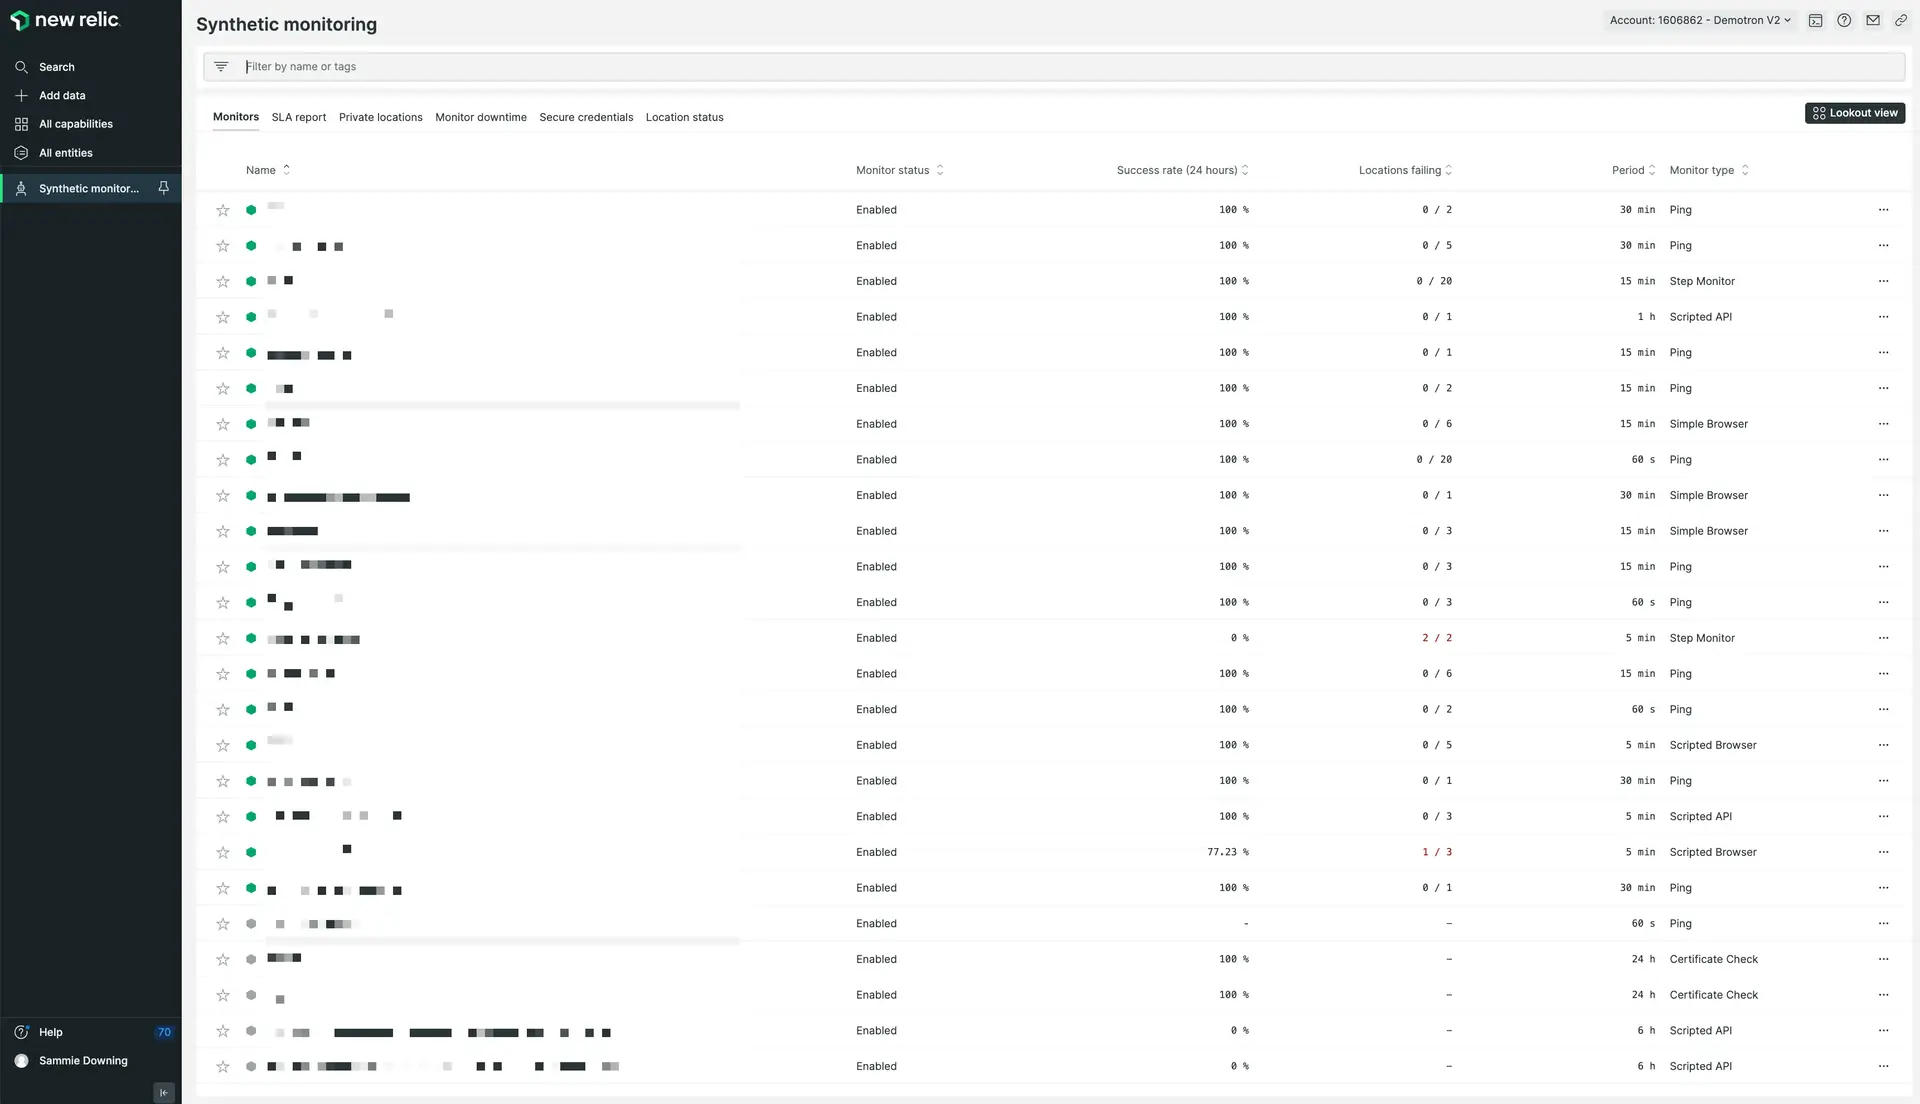
You can check the status and metrics of your monitors with the monitors index.
To get started with synthetics, see Introduction to synthetics and Create a monitor.
Errors inbox
Our errors inbox feature helps you proactively detect, prioritize, and take action on errors before they impact your end users. You'll receive alerts whenever a critical, customer-impacting error arises via your preferred communication channel, like Slack.

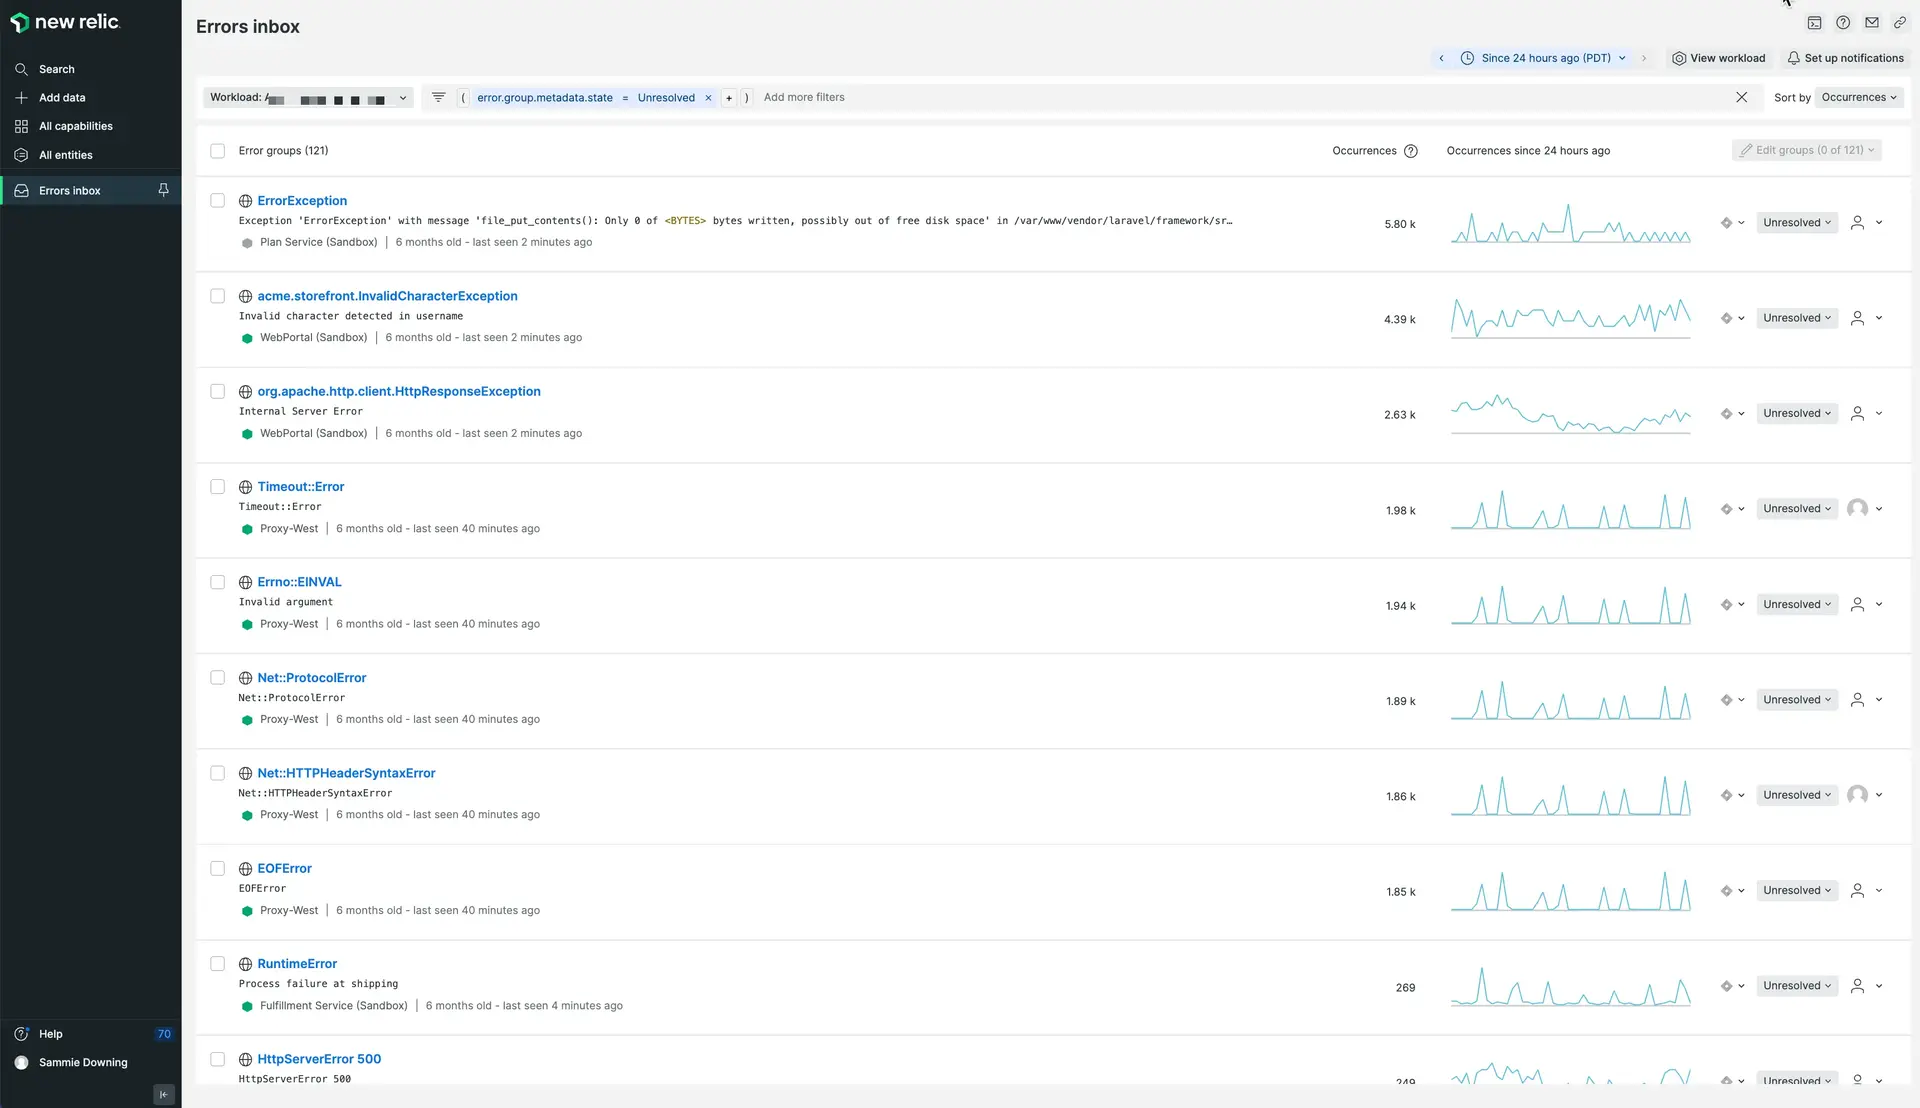
The errors inbox UI lets you easily review the errors of your workloads.
To use errors inbox, you'll need to have set up some workloads. Resources for getting started:
- Read the errors inbox docs
- Watch a short video on setting up errors inbox
What's next?
This guide has helped you set up a strong observability foundation, but that's only the first step in moving towards observability excellence. Next you may want to focus on learning the finer points of New Relic and optimizing your setup. Some ideas for next steps:
- If you think you still need more instrumentation, browse and install more observability tools.
- Read the docs for the tools and features you're using to learn about configuration and customization options.
- Understand and optimize your data ingest.
- Complete a New Relic University class on querying data, and take other classes.
- To go in-depth on planning out your observability goals and achieving observability excellence, see our Observability maturity series. It includes guides for ensuring optimal instrumentation, observability-as-code, alert quality management, and more.