AI monitoring surfaces data about your AI models so you can analyze AI model performance alongside AI app performance. You can find data about your AI models in two areas:
- Model inventory: A centralized view that shows performance and completion data about all AI models in your account. Isolate token usage, keep track of overall performance, or dig into the individual completions your models make.
- Compare models: Conduct comparative performance analysis between two models over time. This page displays data for aggregated analysis of your model performance over time.
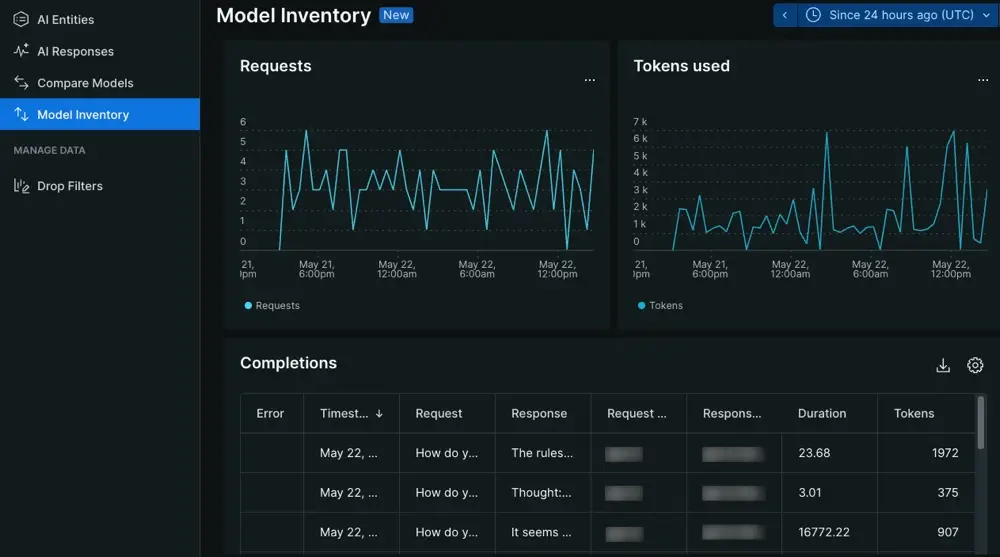
Go to one.newrelic.com > All Capabilities > AI monitoring: From AI monitoring, you can choose between model inventory or model comparison.
Model inventory page
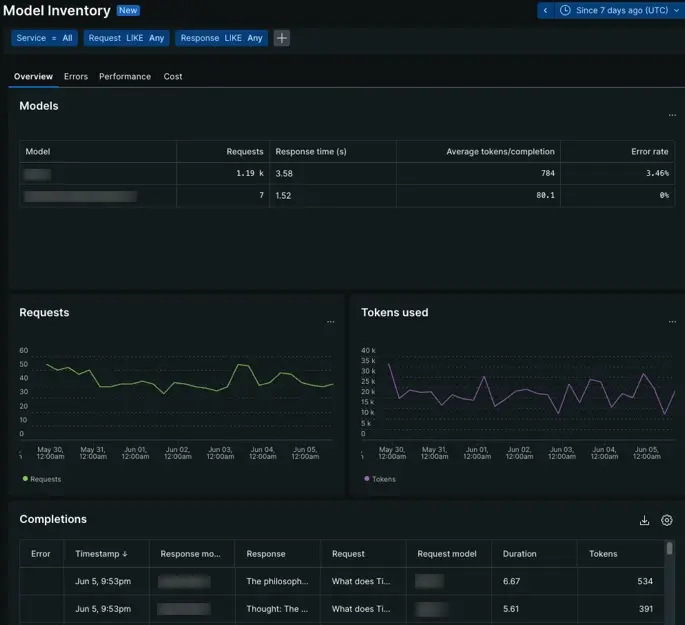
Go to one.newrelic.com > All Capabilities > AI monitoring > Model inventory: View data about interactions with your AI model.
The model inventory page provides insight into the overall performance and usage of your AI models. You can analyze data from calls made to your model, so you can understand how AI models affect your AI app.
From the overview tab, explore the number of requests made to a model against its response times, or analyze time series graphs to see when model behavior changed. From there, investigate the errors, performance, or cost tabs.
Errors tab
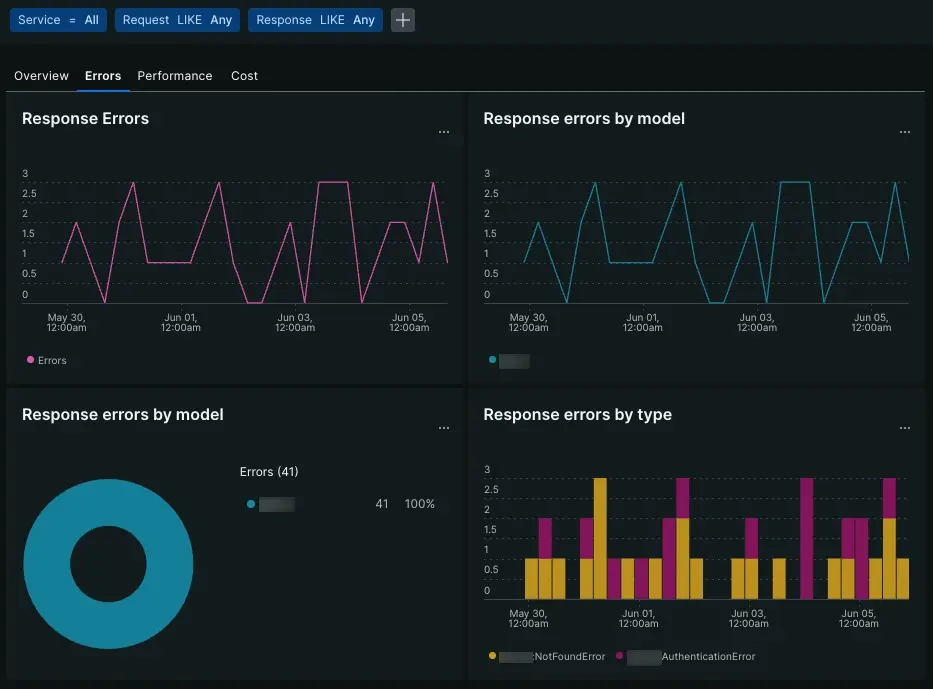
Go to one.newrelic.com > All Capabilities > AI monitoring > Model inventory > Errors: View data about AI model errors.
The errors tab uses time series graphs and tables to organize model errors.
- Response errors: Track the number of errors in aggregate that come from your AI model.
- Response errors by model: Determine if one specific model produces more errors on average, or if one specific error is occurring across your models.
- Response errors by type: View how often certain errors appear.
- Errors table: View error type and message in context of the request and response.
Performance tab
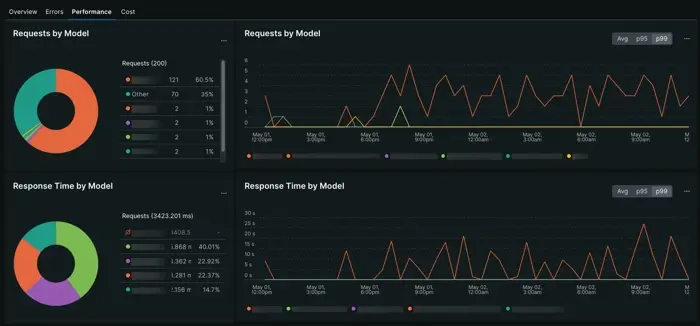
Go to one.newrelic.com > All Capabilities > AI monitoring > Model inventory > Performance: View data about your AI model's performance.
The performance tab aggregates response and request metrics across all your models. Overview the models that take the most time to process a request or create a response with the pie charts, or refer to the time series graphs to track upticks in request or response times. You can use performance charts to locate outliers across your models.
Cost tab
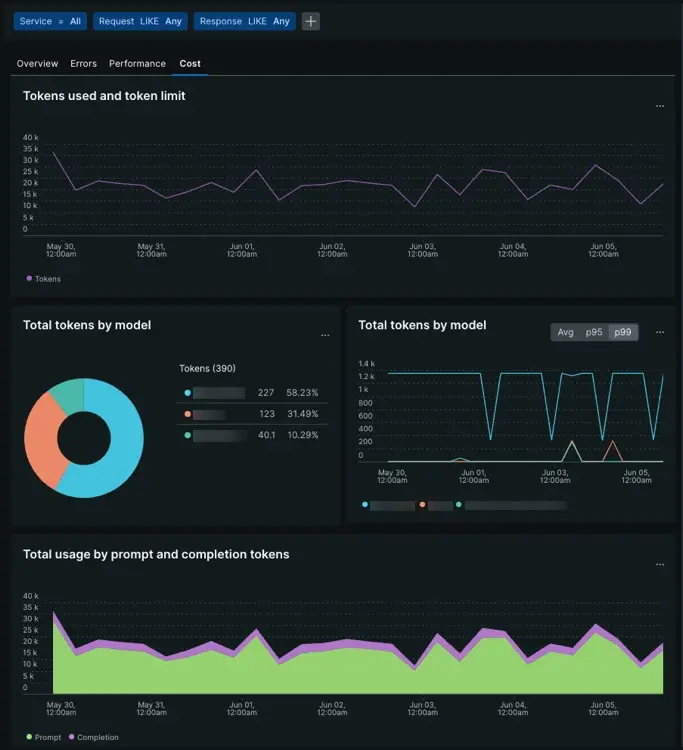
Go to one.newrelic.com > All Capabilities > AI monitoring > Model inventory > Cost: View data about your AI model's cost.
The cost tab uses a combination of time series graphs and pie charts to identify cost drivers amongst your models. Determine the number of tokens came from either prompts or completions, or if certain models cost more on average than others.
- Tokens used and token limit: Evaluate how often your models approach a given token limit.
- Total tokens by models: Determine which of your models use the most tokens on average.
- Total usage by prompt and completion tokens: Understand what ratio of tokens comes from prompts your model accepts against tokens used per completion.
Understanding cost allows you to improve how your AI app uses one or more of your models so your AI toolchain is more cost effective.
Model comparison page
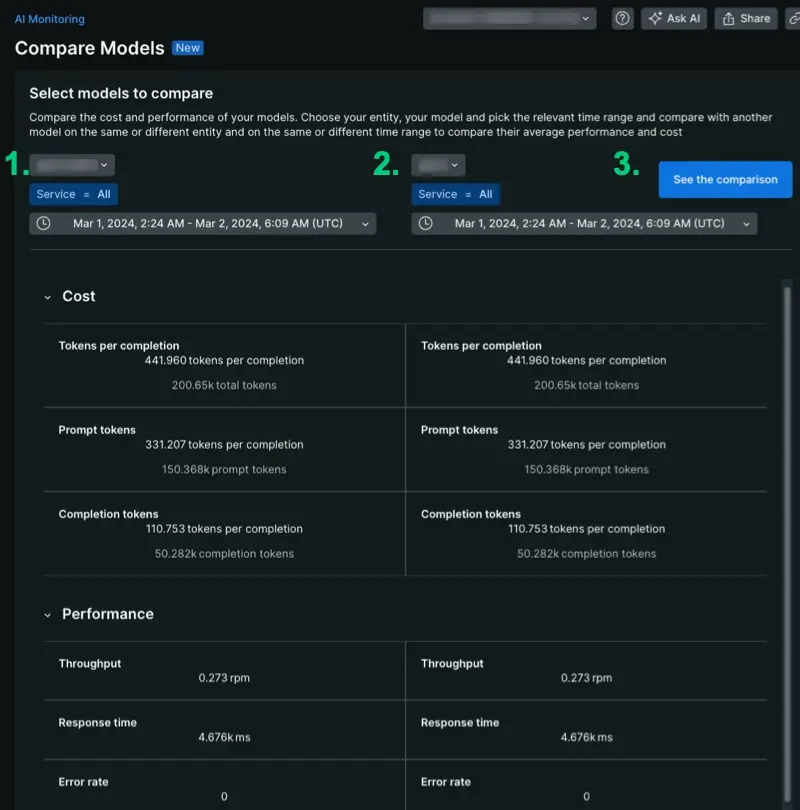
Go to one.newrelic.com > All Capabilities > AI monitoring > Model comparison: Compare data about the different AI models in your stack.
The model comparison page organizes your AI monitoring data to help you conduct comparative analysis. This page scopes your model comparison data to a single account, giving you aggregated data about model cost and performance across one or more apps. To generate data:
- Choose your models from the drop down.
- Scope to one service to see performance in the context of a particular app, or keep the query to
Service = Allto see how a model behaves on average. - Choose time parameters. This tool is flexible: you can make comparisons across different time periods, which lets you see how performance or cost changed before and after a deployment.
Compare model performance
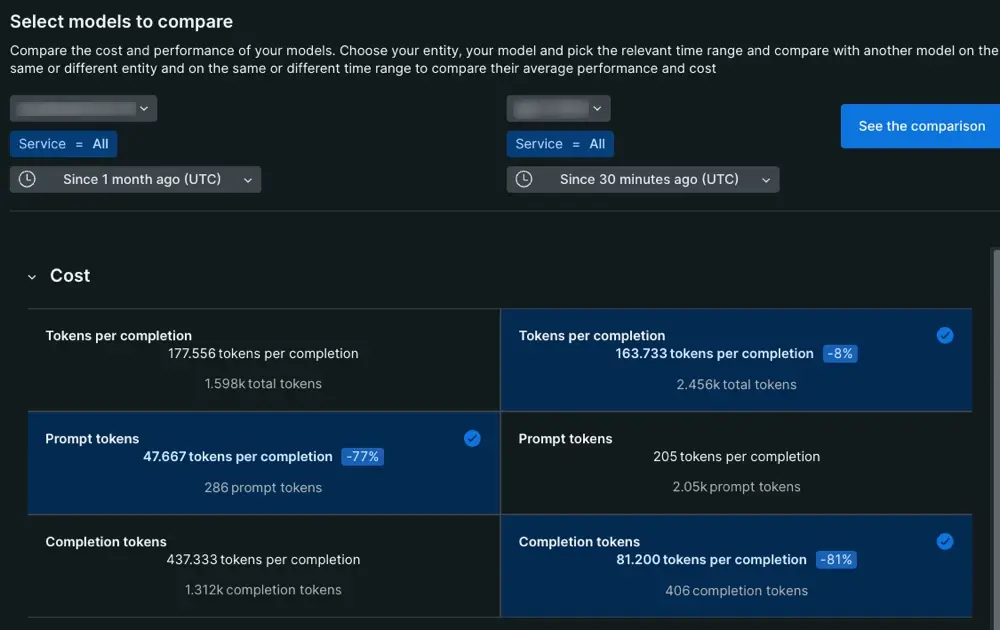
Go to one.newrelic.com > All Capabilities > AI monitoring > Model comparison: Compare performance between different AI models in your stack.
To start conducting comparative analysis, choose a specific service, model, and time range. When you compare models, you can evaluate different metrics aggregated over time, depending on your own settings. Here are some use case examples for comparative analysis:
- Compare two models in the same service: Service X uses model A during week one, but then uses model B on week two. You can compare performance by choosing service X, selecting model A, and setting the dates for week one. On the second side, choose service X, select model B, and set the dates for week two.
- Compare the performance of one model over time: Select choose service X, select model A, and set the dates for week one. On the second side, choose service X, select model A, and set the dates for week two.
- Evaluate model performance in two different services: You have two different applications that use two different models. To compare the total tokens during the last month, choose the relevant parameters for the specific service and specific models, then set the dates for the same time frame.
- Compare two models: You have application that uses model A and you want to measure model A against model B. For every user's prompt, you call model B as a background process. Compare how model A performs relative to model B on the same service during the same time frame.
Compare model cost
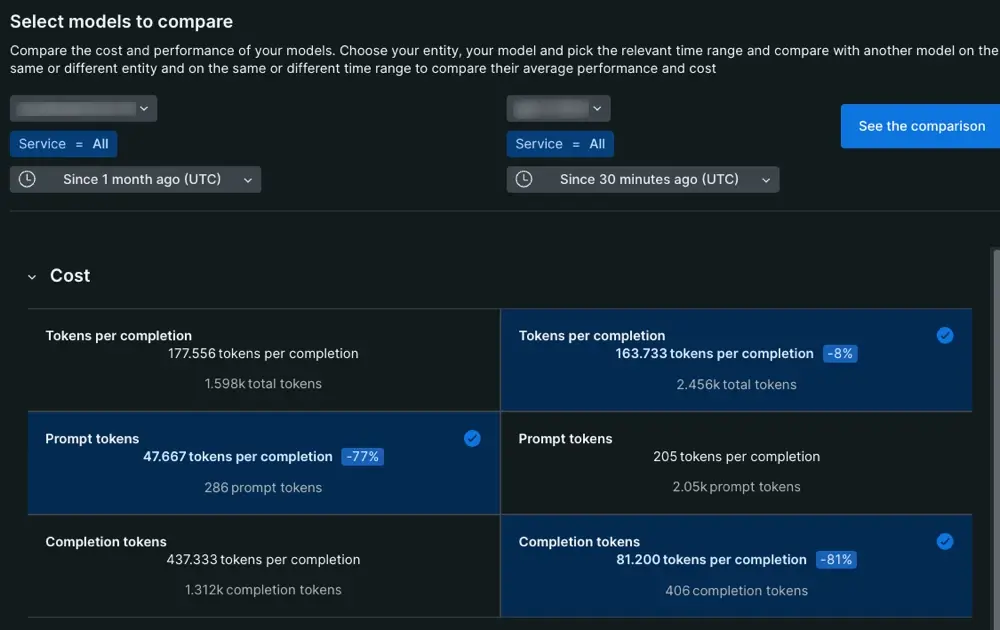
Go to one.newrelic.com > All Capabilities > AI monitoring > Model comparison: Compare cost between different AI models in your stack.
The model cost column breaks down completion events into two parts: the prompt given to the model and the final response the model delivers to the end user.
- Tokens per completion: The token average for all completion events.
- Prompt tokens: The token average for prompts. This token average includes prompts created by prompt engineers and end users.
- Completion tokens: The number of tokens consumed by the model when it generates the response delivered to the end user.
When analyzing this column, the value for completion tokens and prompt tokens should equal the value in tokens per completion.
What's next?
Now that you know how to find your data, you can explore other features that AI monitoring has to offer.
- Want to analyze the performance of your AI app? Check out our doc about the AI app response pages.
- Concerned about sensitive information? Learn to set up drop filters.
- If you want forward user feedback information about your app's AI responses to New Relic, follow our procedures to update your app code to get user feedback in the UI.