This document explains:
팁
This is a description of traditional, synchronous page load timing. Browser can also monitor asynchronous page load timing.
Page load process
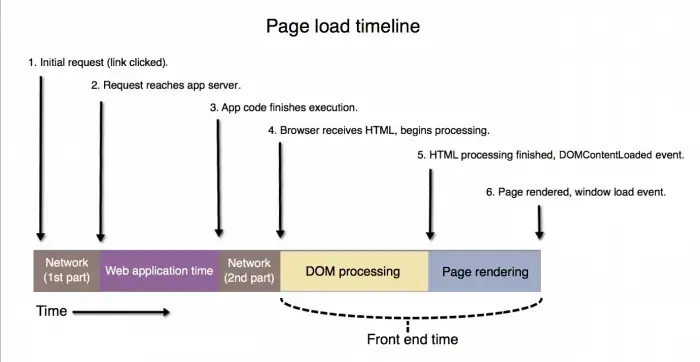
Here are the major steps in the loading of most web pages. The numbers 1-6 in the diagram correspond to the numbered steps below.

Page load timeline: The steps involved in a web page load. Browser monitoring charts display the following segments of that process: Network, Web application, DOM processing, and Page rendering.
- A page load begins when a user selects a hyperlink, submits a form, or types a URL in a browser. This is also referred to as the initial request or the navigation start. The user's action sends a request across the network to the web application server.
- The request reaches the application for processing. (The request may take some time to start being processed. This could be the result of request queuing or it could be other factors.)
- The app finishes processing and sends an HTML response back across the network to the user's browser. This is sometimes referred to as response start or first byte.
- (Time To First Byte) The user's browser begins receiving the HTML response, and starts to process the Document Object Model, or DOM.
- The DOM finishes loading; this point is known as DOM ready. Using the DOM, the user's browser starts to render the page.
- The page finishes rendering in the user's browser and the window load event fires. (For pages that use asynchronous loading, some elements may continue to load after the window load event occurs.)
Page load time charts in browser monitoring
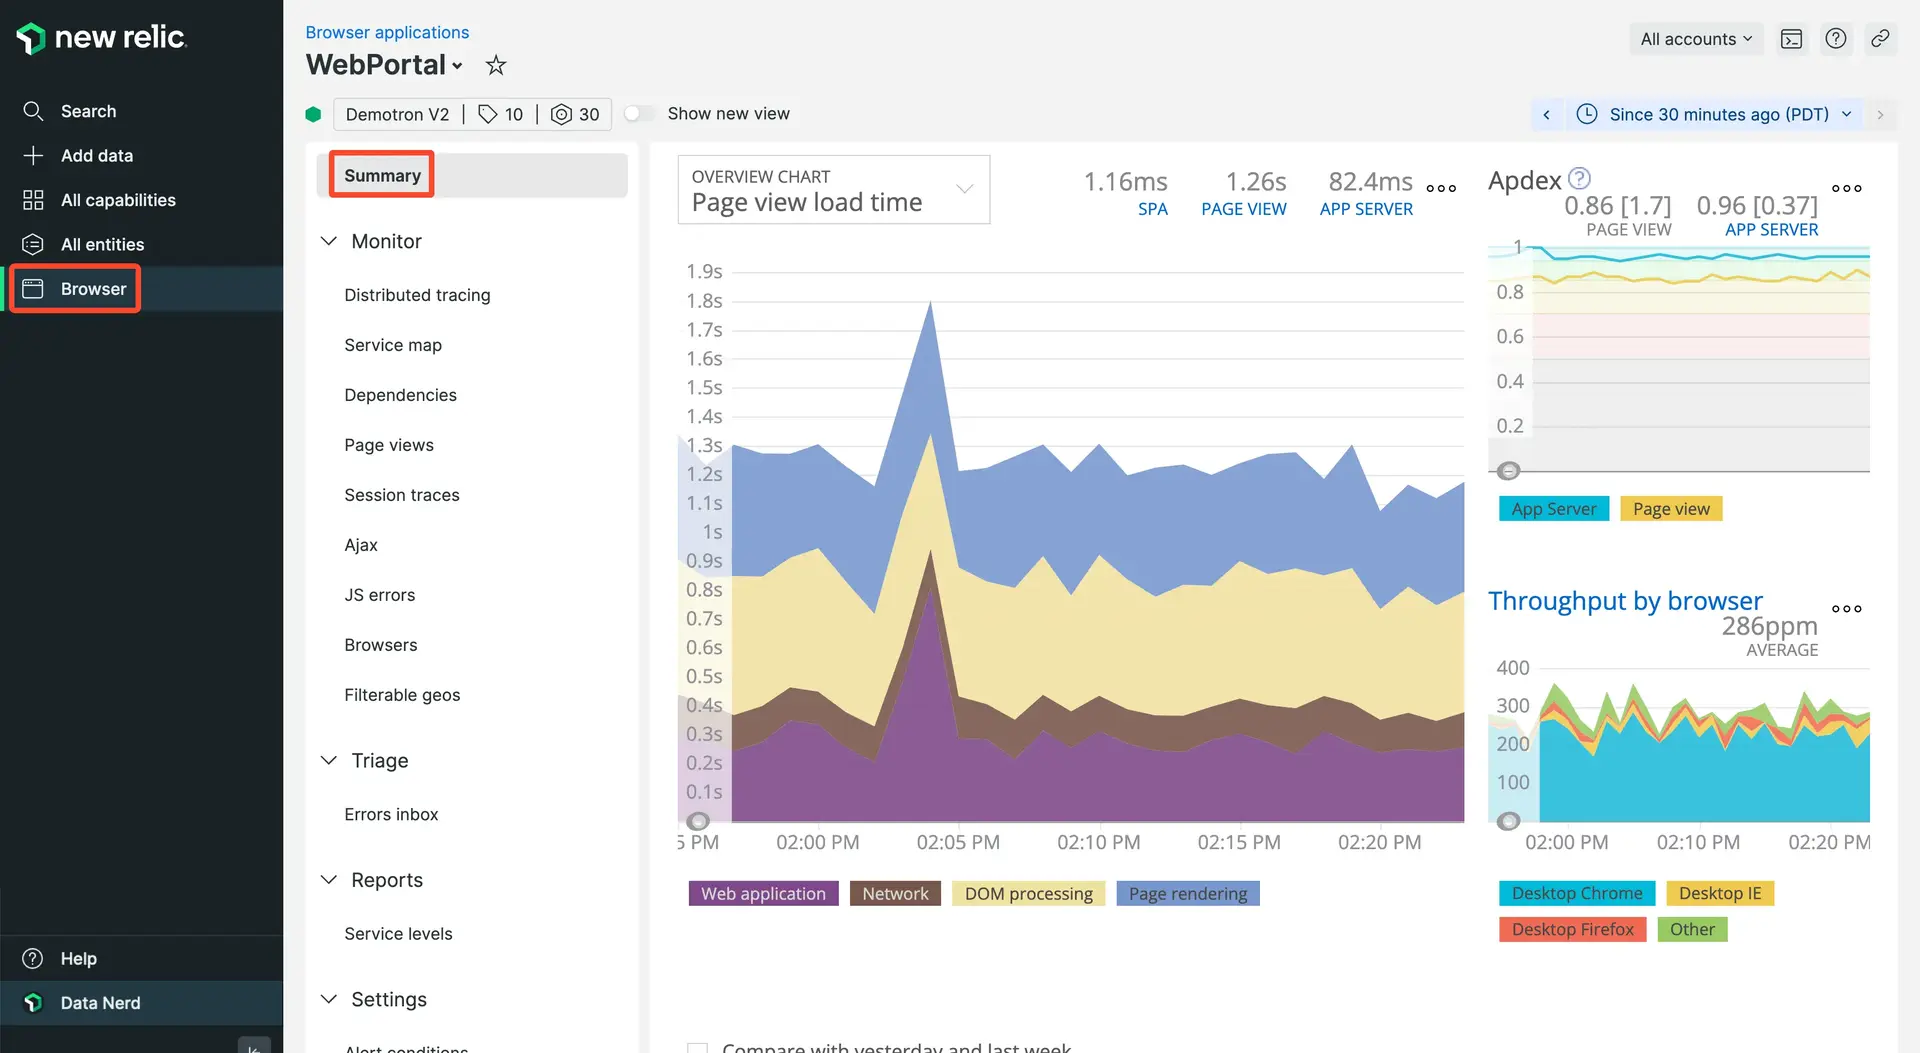
Browser monitoring captures the major page load timing segments in the browser Summary page and the Page views page. If you have SPA monitoring enabled, you will have access to both this chart and SPA-specific charts. The charts show:
- Network
- Web application time
- DOM processing
- Page rendering
- Other segments as applicable, such as request queuing
The chart colors match the colors in the page load timing diagram.

one.newrelic.com > All capabilities > Browser > (select an app) > Summary: The load time chart appears on the Summary and Page views page.
The way browser collects these times depends on the browser's capability to use the Navigation Timing Specification API. You can add custom page load timing events with the browser agent API.
Here are descriptions of the activity included in the browser load time chart segments:
App server requests vs. browser transactions
Often the number of app server transactions (requests per minute or rpm) is larger than the number of browser transactions (pages per minute or ppm) for the same application. For more information, see the troubleshooting procedures.
Outliers
No matter how well your application performs, there will be some slow browsers, platforms, and networks that make your overall aggregate response times appear slower. To minimize the skew caused by outliers, page load timing clamps and scales the end user response times that are greater than 4.5 times your application's browser Apdex T setting to 4.5 times the Apdex T, or to 13.5 seconds, whichever is greater. (Histogram outliers are cut off at 95%.)
For example, if your application's end user Apdex T threshold is 8 seconds, those response times will be clamped at 36 seconds. This minimizes the impact of these response times on your overall application but still provides accounting for "frustrated" Apdex scores.
For SPA monitoring, outliers are handled differently. When the duration of an initial page load or route change reaches 30 minutes, that event is treated as invalid data and is discarded.
Next steps
Learn more about page load timing with these docs: