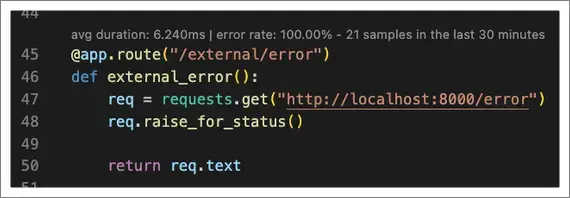
Without having to seek it out, performance data is displayed contextually in the editor so that it can inform the work at hand. Say you’re working on a bug fix, and happen to notice that the area of the code you’re working in has an elevated error rate. Maybe you address that issue as part of your bug fix so that it doesn’t escalate into a bigger problem.

CodeStream shows the average duration and error rate, for the last 30 minutes, in a CodeLens above each method instrumented by the New Relic APM agents. For Visual Studio, a New Relic icon is displayed in the editor gutter in lieu of a CodeLens. Metrics are calculated for the service currently selected in the CodeStream pane. Expand a different service and the metrics update accordingly.
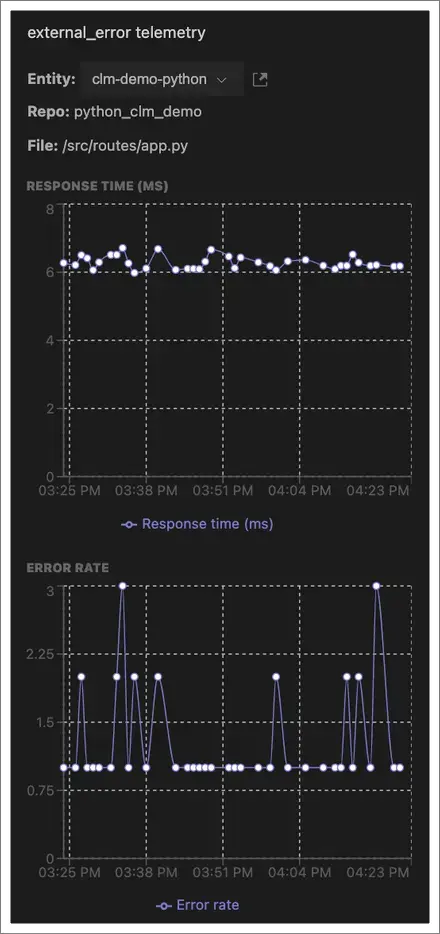
Click the CodeLens to see charts visualizing each of the metrics. If the repository is associated with multiple New Relic-monitored services, you can easily switch between them. This changes the service upon which the code-level metrics displayed in both the charts and the editor are based, and also change the service selection in the CodeStream pane.

Along with a chart of the error rate you’ll also see a list of the actual errors happening in the same timeframe, including the number of occurrences for each. If the error rate is spiking, and you see one particular error is causing the problem, you can click on it to view the stack trace and start collaborating on resolution.
Coverage
The New Relic agent attempts to automatically collect data for functions on classes that are tied to HTTP requests. In many cases, and with many frameworks that use an MVC framework, these are often methods on a Controller class.
Because all requests by the New Relic agent are not collected all the time, it’s possible that low-traffic methods won't see any data. If data is missing for a specific method that you wish to see results for, you can use custom instrumentation to fill any gaps. See guidance for Java, .NET, PHP, Python, Ruby, Go and Node.js.
Run the following NRQL query to identify where you might see CodeLenses with code-level metrics for one of your services. Just replace the example entity.guid value with the one for the given service. In the query results, look at the code.* attributes to see if any of them represent your code, and not framework code.
SELECT * FROM SpanWHERE entity.guid = 'YOUR_ENTITY_GUID' AND code.function IS NOT NULLSINCE 30 minutes ago LIMIT MAXRequirements
To see in-editor performance data, your service must meet the requirements listed below, and the service should have collected data in the last 30 minutes.
- Distributed tracing must be enabled. Distributed tracing is on by default in recent versions of all agents, so you only need to worry about this if you've disabled distributed tracing.
- If you're using VS Code, you must have a language support extension installed for Java, C#, PHP, Python, Go, or Ruby.
- Java: Code-level metrics are only available for projects implemented with a supported Java framework. Note that Kotlin support is only available in IntelliJ.
- .NET: If you're using Visual Studio, make sure that you have CodeLenses enabled from Tools > Options > Text Editor > All Languages > CodeLens and ensure that both Enable CodeLens and Show CodeStream Code-Level Metrics are checked.
- Node.js: If your codebase include anonymous functions, you must use either change tracking to send deployment information to New Relic, or send your build SHA using an environment variable in your build pipeline.
- Python: Code-level metrics are only available for projects implemented with a supported Python framework and for PHP version 7.0 or higher.
- Ruby: Code-level metrics are only available for Rails applications and Ruby methods with manual traces (learn more about Ruby methods and CodeStream).
You can turn CodeLenses off by going to the CodeStream section of your IDE's settings and unchecking the CodeStream: Show Golden Signals In Editor setting.