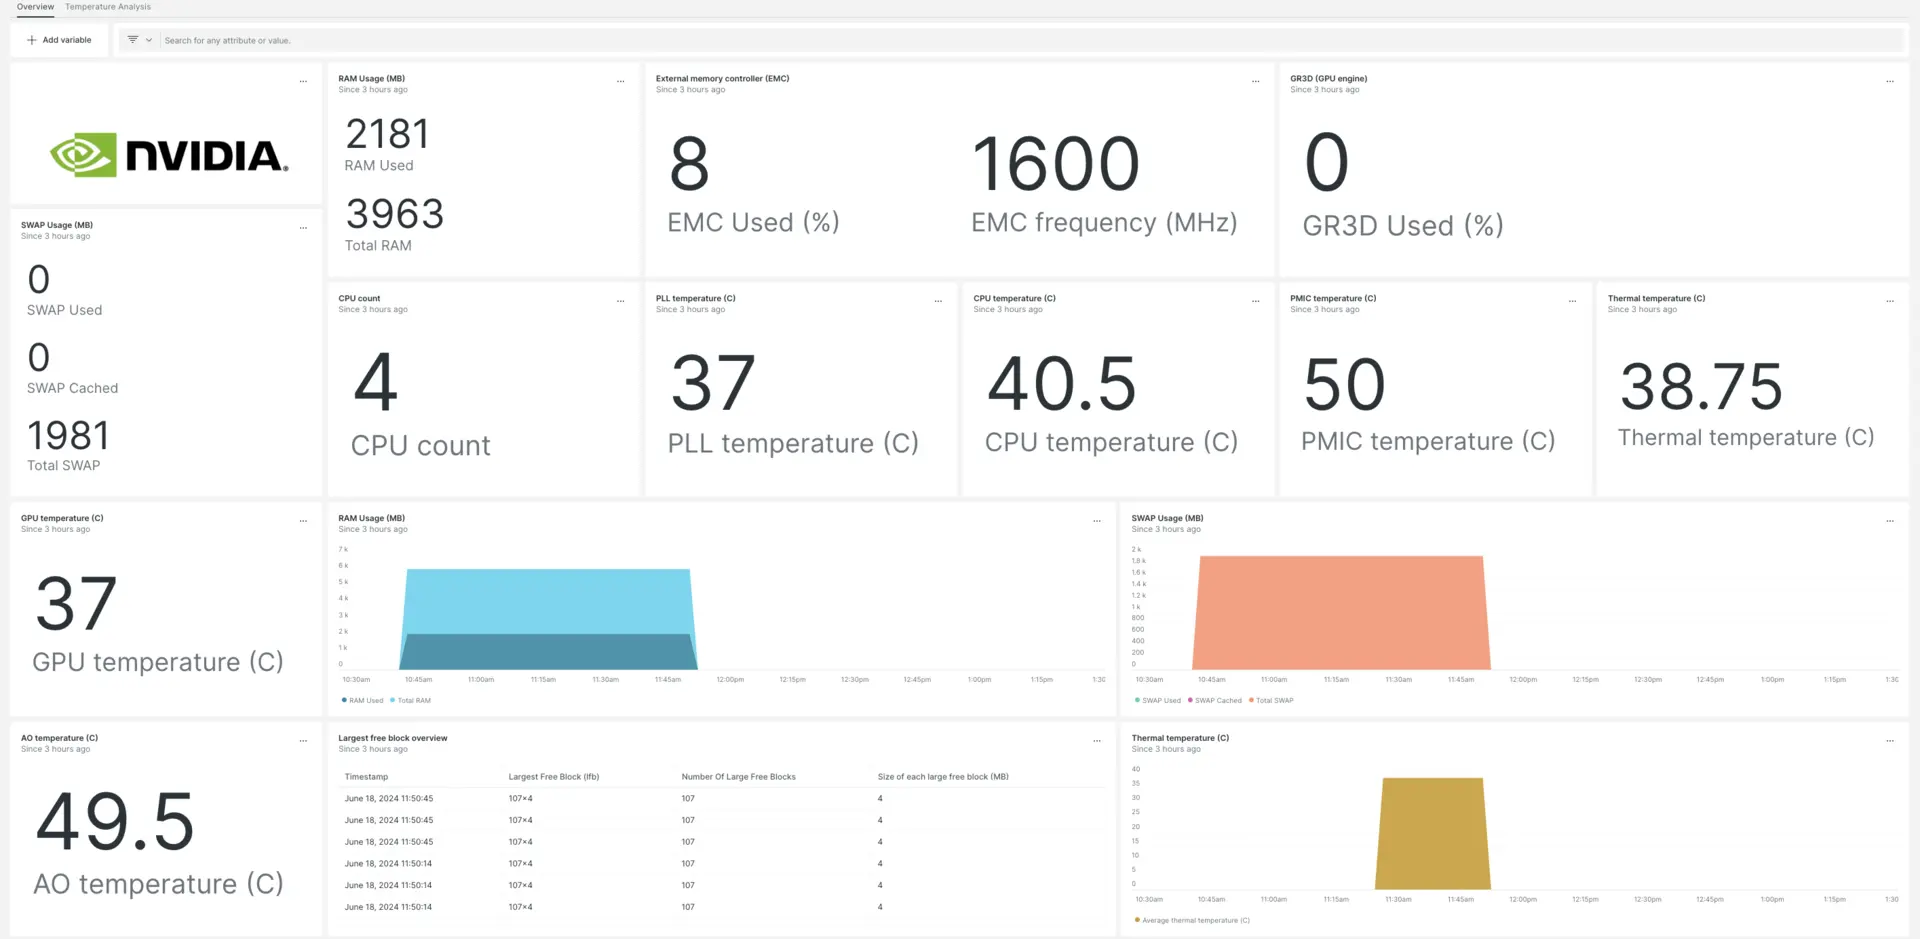
Our NVIDIA Jetson integration collects and sends data about your tegrastats utility to New Relic, where you can monitor CPU, GPU, RAM, and temperature readings about your NVIDIA Jetson device.

After setting up our NVIDIA Jetson integration, we give you a dashboard for your NVIDIA Jetson metrics.
Install the NVIDIA Jetson integration
Follow these steps to collect data about your NVIDIA Jetson device:
Install the infrastructure agent
To use the NVIDIA Jetson integration, you need to first install the infrastructure agent onto your host. The infrastructure agent monitors the host itself, while the integration itself extends your monitoring to include NVIDIA Jetson-specific data.
Save tegrastats to a file
From your shell environment, change to the tegrastats directory and run this command to save NVIDIA Jetson metrics at 5 second intervals:
$sudo tegrastats --interval 5000 --logfile tegrastatsEnable the NVIDIA Jetson integration with nri-flex
To set up the NVIDIA Jetson integration, follow these steps:
Create a file named
nvidia-jetson-config.ymland save it in the integrations directory:bash$sudo nano /etc/newrelic-infra/integrations.d/nvidia-jetson-config.ymlEnable the agent to capture data from NVIDIA Jetson by adding the following snippet to your
nvidia-jetson-config.ymlfile:integrations:- name: nri-flexconfig:name: JetsonMetricsapis:- event_type: jetsonTegrastatscommands:- run: tail -n 3 path/to/tegrastatssplit: horizontalset_header: [ram_used, ram_total]regex_match: truesplit_by: "RAM (\\d+)/(\\d+)"- run: tail -n 3 path/to/tegrastatssplit: horizontalset_header: [lfb_num, lfb_size]regex_match: truesplit_by: "\\(lfb (\\d+)x(\\d+)MB\\)"- run: tail -n 3 path/to/tegrastatssplit: horizontalset_header: [swap_used, swap_total, swap_cached]regex_match: truesplit_by: "SWAP (\\d+)/(\\d+) \\(cached (\\d+)MB\\)"- run: tail -n 3 path/to/tegrastatssplit: horizontalset_header: [iram_used, iram_total, lfb_block]regex_match: truesplit_by: "IRAM (\\d+)/(\\d+)kB\\(lfb (\\d+)kB\\)"- run: tail -n 3 path/to/tegrastatssplit: horizontalset_header: [cpu1_usage, cpu1_freq]regex_match: truesplit_by: "CPU \\[(\\d+)%@(\\d+)"- run: tail -n 3 path/to/tegrastatssplit: horizontalset_header: [cpu2_usage, cpu2_freq]regex_match: truesplit_by: ",(\\d+)%@(\\d+)"- run: tail -n 3 path/to/tegrastatssplit: horizontalset_header: [cpu3_usage, cpu3_freq]regex_match: truesplit_by: ",(\\d+)%@(\\d+)"- run: tail -n 3 path/to/tegrastatssplit: horizontalset_header: [cpu4_usage, cpu4_freq]regex_match: truesplit_by: ",(\\d+)%@(\\d+)\\]"- run: tail -n 3 path/to/tegrastatssplit: horizontalset_header: [emc_freq_pct, emc_freq_val]regex_match: truesplit_by: "EMC_FREQ (\\d+)%@(\\d+)"- run: tail -n 3 path/to/tegrastatssplit: horizontalset_header: [gr3d_freq_pct, gr3d_freq_val, ape, pll_temp]regex_match: truesplit_by: "GR3D_FREQ (\\d+)%@(\\d+) APE (\\d+) PLL@(\\d+)C"- run: tail -n 3 path/to/tegrastatssplit: horizontalset_header: [cpu_temp, pmic_temp, gpu_temp]regex_match: truesplit_by: "CPU@(\\d+\\.?\\d*)C? PMIC@(\\d+\\.?\\d*)C? GPU@(\\d+\\.?\\d*)C?"- run: tail -n 3 path/to/tegrastatssplit: horizontalset_header: [ao_temp, thermal_temp]regex_match: truesplit_by: "AO@(\\d+\\.?\\d*)C? thermal@(\\d+\\.?\\d*)C?"- run: tail -n 3 path/to/tegrastatssplit: horizontalset_header: [pom_in_currect, pom_in_peak]regex_match: truesplit_by: "POM_5V_IN (\\d+)/(\\d+)"- run: tail -n 3 path/to/tegrastatssplit: horizontalset_header: [pom_gpu_used, pom_gpu_total]regex_match: truesplit_by: "POM_5V_GPU (\\d+)/(\\d+)"- run: tail -n 3 path/to/tegrastatssplit: horizontalset_header: [pom_cpu_used, pom_cpu_total]regex_match: truesplit_by: "POM_5V_CPU (\\d+)/(\\d+)"
Restart the New Relic infrastructure agent
Restart your infrastructure agent by running this command in your shell environment:
$sudo systemctl restart newrelic-infra.serviceWait a couple of minutes as your application sends metrics to one.newrelic.com.
Find your data
You can use our pre-built dashboard template to monitor your NVIDIA Jetson data. Follow these steps to use our pre-built dashboard template:
From one.newrelic.com, go to the + Integrations & Agents page, then click Dashboards
Search for NVIDIA Jetson in the search bar, then select NVIDIA Jetson to install the dashboard.
View your dashboard by going to one.newrelic.com > All Capabilities > Dashboards.
For docs on using and editing dashboards, see our dashboard docs.
Query your data with NRQL
With NVIDIA Jetson reporting data, you can also build queries to learn more about your device's performance:
From any page in one.newrelic.com, click Query your data at the bottom of your browser.
Build your query. For example, this is an example NRQL query to view the GPU temperature:
SELECT latest(gpu_temp) as 'GPU temperature (C)' from jetsonTegrastats
What's next?
To learn more about building NRQL queries and generating dashboards, check out these docs:
- Introduction to the query builder to create basic and advanced queries.
- Introduction to dashboards to customize your dashboard and carry out different actions.
- Manage your dashboard to adjust your dashboards display mode, or to add more content to your dashboard.