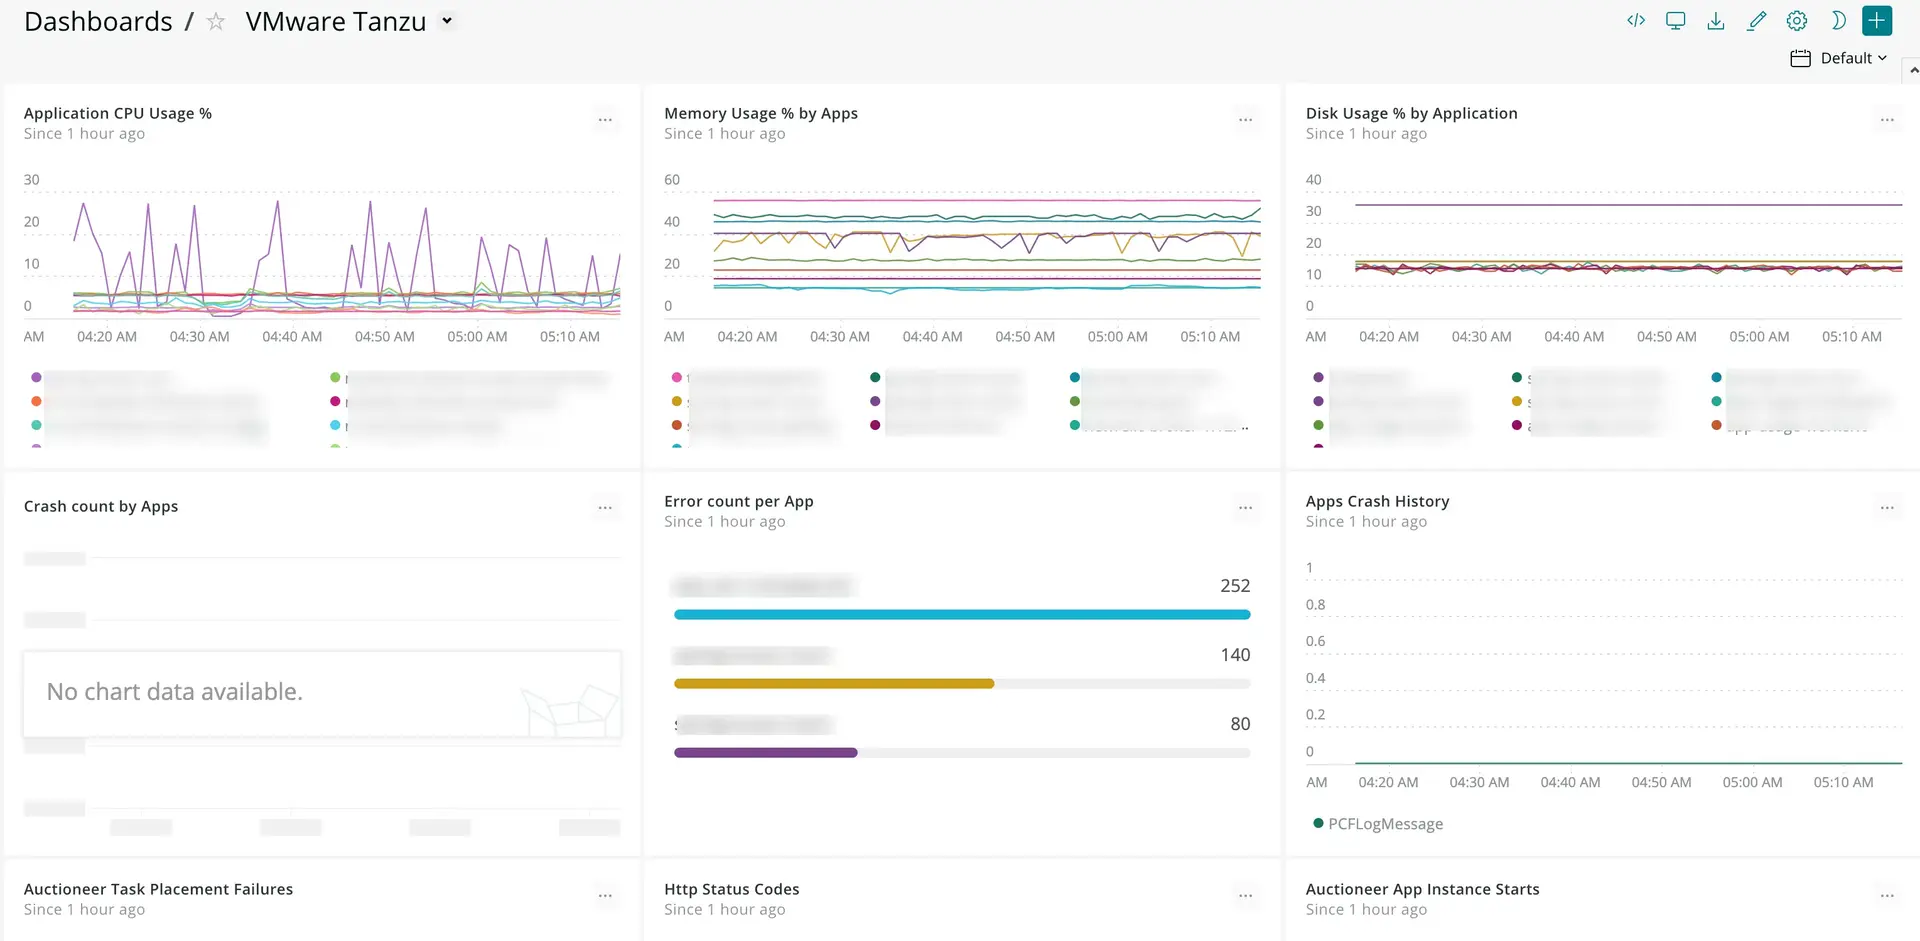
New Relic Nozzle for VMware Tanzu collects metrics and events generated by all VMware Tanzu components and applications that run on VMware Tanzu Diego cells via the Loggregator Firehose. The nozzle collects data via the Remote Log Proxy (RLP) gateway and pushes it to New Relic for processing and visualization.

Overview
After installation, the nozzle starts collecting and pushing Firehose events to New Relic for processing and visualization. New Relic organizes the data based on Firehose event types, and shows each Firehose event type in its own separate dashboard.
The nozzle can be installed as a tile in Ops Manager or deployed using the CLI command cf push as a regular application. You can then monitor the health and performance of your VMware Tanzu deployments, and set based on any metrics that are collected from VMware Tanzu Firehose.
Prerequisites
New Relic Nozzle for VMware Tanzu has the following requirements:
- An active New Relic account with a Pro or Pro Trial license. If you do not already have a New Relic account, you can obtain a 14-day free trial license.
- New Relic Insights included in the license
- VMware Tanzu versions v2.10.x through v10.x.
Key features
You can monitor health and performance data of VMware Tanzu components, including:
- VMware Tanzu Domain
- VMware Tanzu Deployment
- Firehose Event Type
- Origin
- Job
- Component IP Address
- Application Detail
- Container
Select the item from a list of values for any of the above metrics and filter the dashboard based on the selected value. You can also filter a dashboard by multiple metrics.s
Event filtering
When a large number of events is streamed from the Firehose, you may want to filter out undesired events that are generated by the Firehose. If you need the nozzle to capture any of the Firehose event types (ValueMetric, CounterEvent, ContainerMetric, HttpStartStop, LogMessage), you must specify them as a comma-separated list of event types in the "Selected Events" property, located in the Advanced Settings tab of the tile settings.
Starting with version 2.X of the nozzle, ContainerMetric, CounterEvent, and ValueMetric events are aggregated. Events include the min, max, sum, sample count, and last value of each metric. This reduces the number of events created by the nozzle while still providing detail on each metric type.
If needed, configure LogMessage Filters to include or exclude subsets of LogMessage events.
If needed, configure LogMessage Filters to include or exclude subsets of LogMessage events.
Filter examples
- LogMessage Source Include Filter: Only generate events for log messages with a source listed in this comma or pipe-separated list.
- LogMessage Source Exclude Filter: Do not generate events for log messages with a source listed in this comma or pipe-separated list.
- LogMessage Message Include Filter: Only generate events for log messages that contain text listed in this comma or pipe-separated list.
- LogMessage Message Exclude Filter: Do not generate events for log messages that contain text listed in this comma or pipe-separated list.
Multiple LogMessage filters can be combined to limit event creation. Include filters are processed before exclude filters.
중요
Note: When you run the nozzle as an application, you can use the above environment variables in the application manifest file.
Product snapshot
The following table provides version and version-support information about New Relic Nozzle for VMware Tanzu.
Element | Details |
|---|---|
Tile version | 2.11.4 |
Release date | March 15, 2026 |
Software component version | New Relic Nozzle v2.11.4 |
Compatible Ops Manager version(s) | v2.9.x, v2.10.x and v3.x |
Compatible VMware Tanzu Application Service for VMs versions | v2.10.x, v2.11.x, v2.12.x, v2.13.x, v3.0.x, v4.0.x , v5.0.x , v6.0.x & v10.x |
BOSH stemcell version | Ubuntu Jammy |
IaaS support | AWS, GCP, Azure, and vSphere |
Feedback
If you have a feature request, questions, or information about a bug, please submit an issue on github.