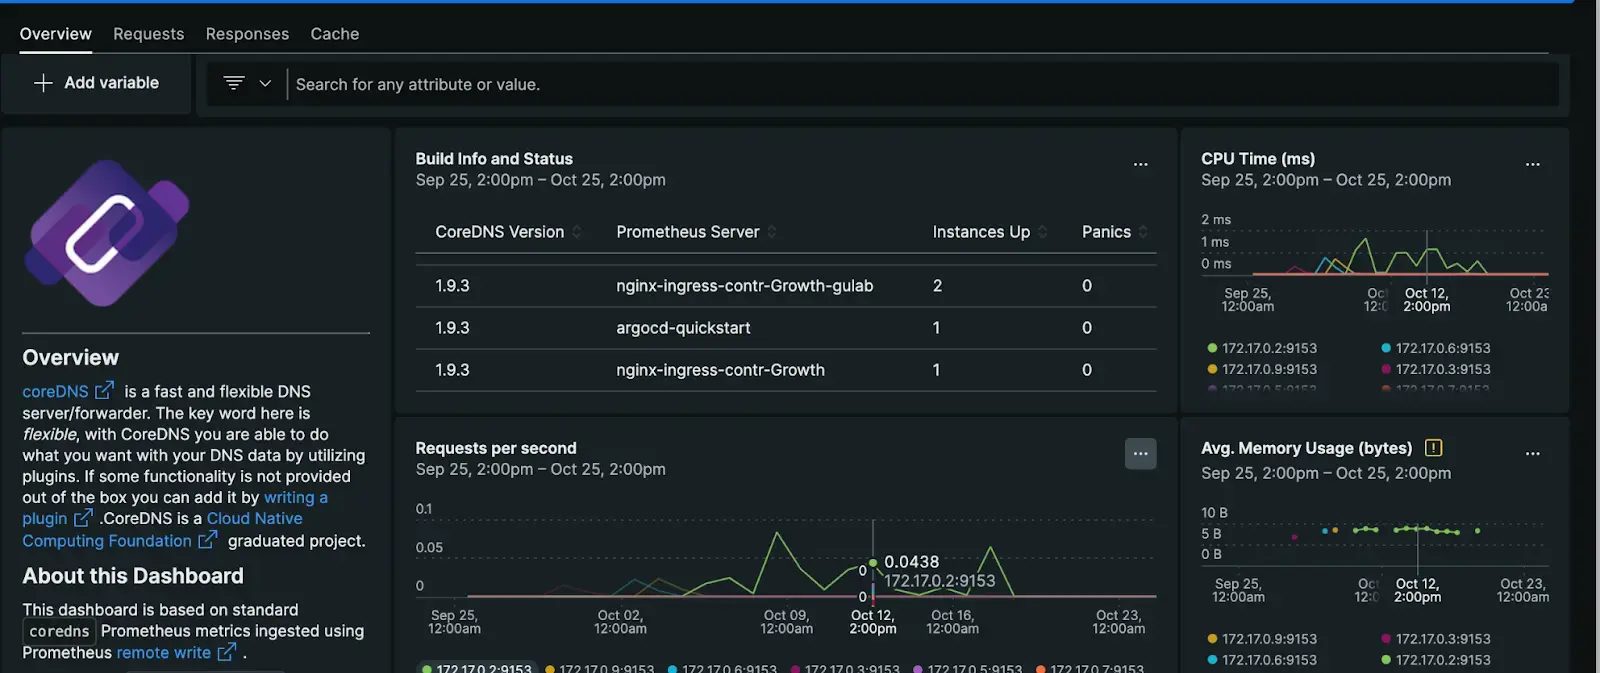
CoreDNS is a DNS server and forwarder written in Go that chains plugins. Each plugin performs a DNS function.
Use New Relic for visualizing CoreDNS performance, alerting on potential errors, and troubleshooting in an error scenario. CoreDNS is a critical Kubernetes cluster component. With New Relic you can monitor:
- Your system health
- CoreDNS latency
- CoreDNS errors
- Cache stats

Enable the integration
Follow these steps to enable the integration.
Follow the CoreDNS documentation for Prometheus to discover the CoreDNS metrics endpoints.
Set up Prometheus monitoring. Prometheus metrics needs to be integrated with New Relic, you can use the Prometheus Agent or the Remote Write integration, see how to send Prometheus metrics.
중요
The Prometheus Agent only scrapes metrics by default from a set of integrations.
In this case, you must identify your pod or endpoint with one of the these labels
app.kubernetes.io/name,app.newrelic.io/name,k8s-appcontaining the stringcorednsorkube-dns.Use the following query to confirm metrics are being ingested as expected:
FROM Metric SELECT count(*) WHERE metricName LIKE 'coredns_%' FACET metricName LIMIT MAXInstall the CoreDNS quickstart to access built-in dashboards and alerts.
Once you imported, you can edit or clone the assets to adapt them to your specific requirements.
중요
Some charts of the dashboard include queries with conditions that require the identification of your pod or endpoint with one of the these labels
app.kubernetes.io/name,app.newrelic.io/name,k8s-appcontaining the stringcorednsorkube-dns.
Find and use the data
Metrics
Prometheus metrics are stored as dimensional metrics. You can query using NRQL or use the Data Explorer to browse the available metrics, facet, and filter by the associated dimensions.
The different sets of metrics exposed by this integration are defined in the CoreDNS documentation.
Use the following NRQL queries to understand the metrics being ingested in New Relic:
List unique metric names:
FROM Metric SELECT uniques(metricName) WHERE metricName LIKE 'coredns_%' LIMIT MAXCount number of metric updates:
FROM Metric SELECT datapointcount() WHERE metricName LIKE 'coredns_%' LIMIT MAXEstimate data ingestion (daily ingest, in bytes):
FROM Metric SELECT bytecountestimate() WHERE metricName LIKE 'coredns_%' SINCE 1 day ago
Troubleshooting
Follow the troubleshooting tips from CoreDNS documentation to make sure that metrics are configured as expected on your cluster.
You can also check the specific troubleshooting guidelines for Prometheus integrations.