Traefik is an open-source Edge Router that makes publishing your services a fun and easy experience. It receives requests on behalf of your system and finds out which components are responsible for handling them.
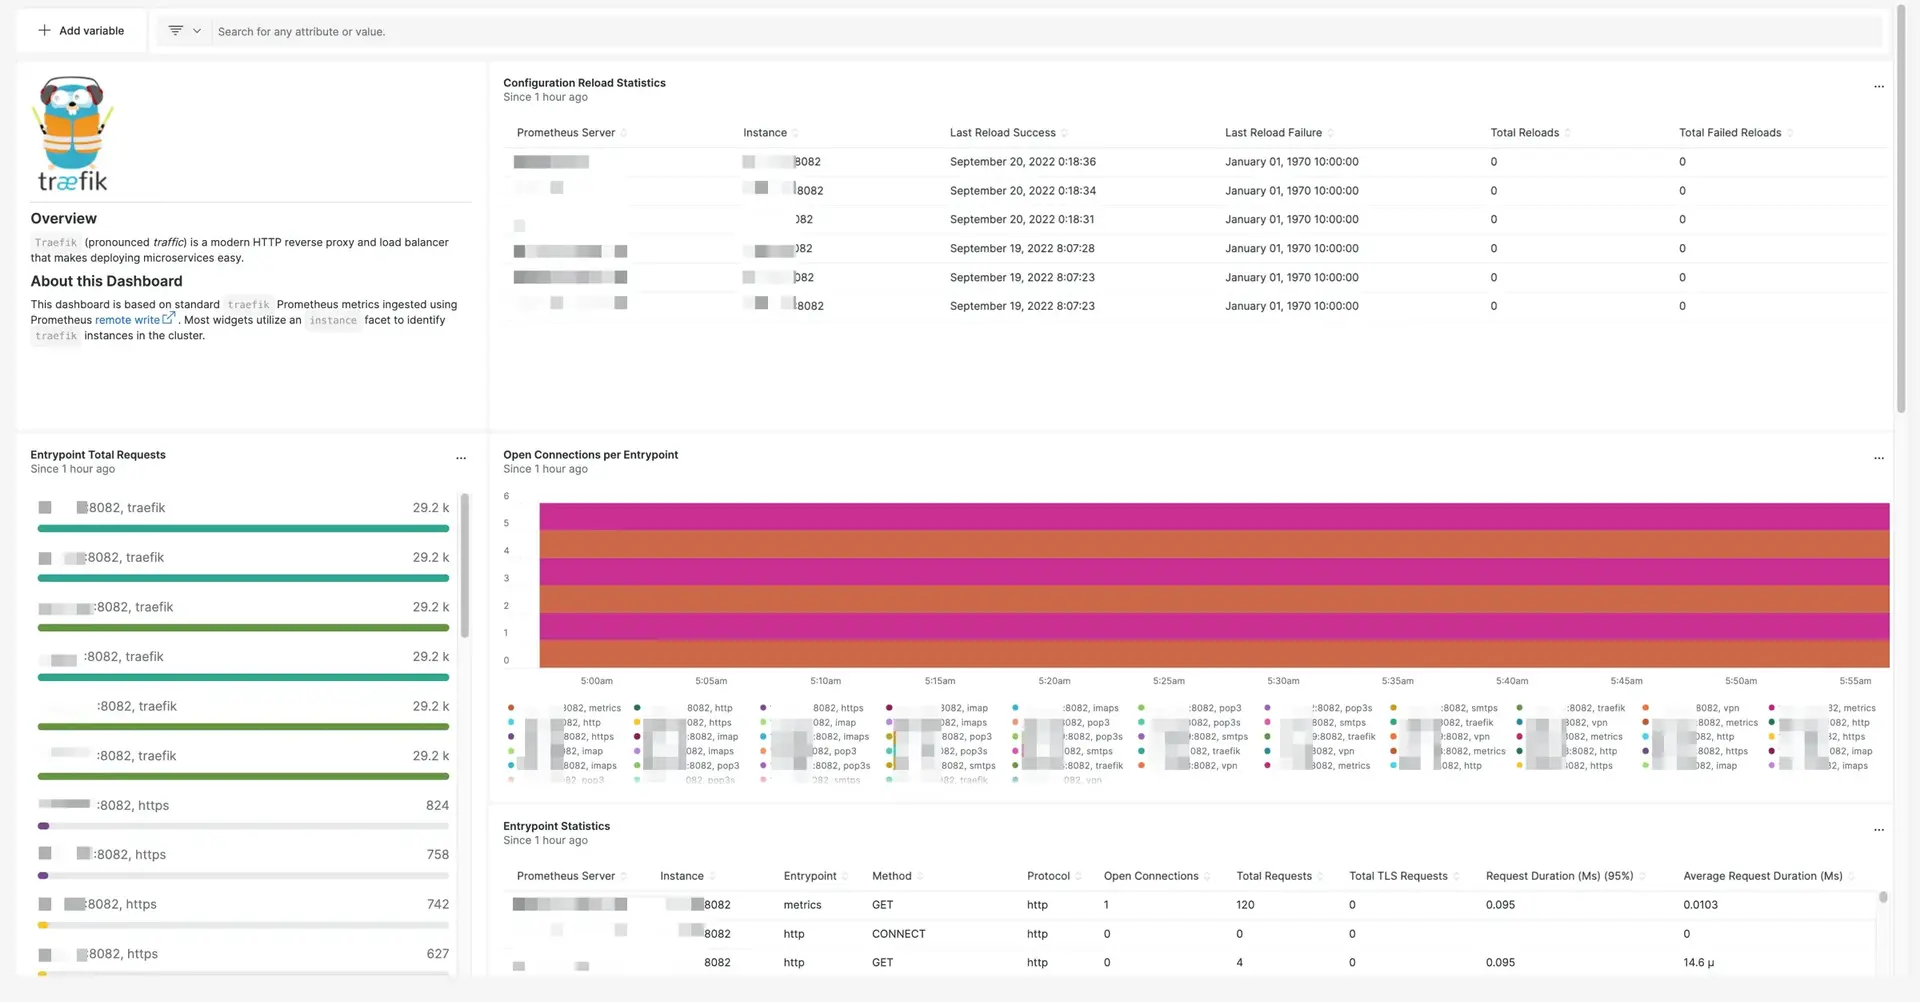
Use New Relic for easily installing a curated dashboard to monitor the health of your Traefik instances.

Enable the integration
Follow these steps to enable the integration.
Follow the Traefik documentation to setup Traefik proxy on Kubernetes for Prometheus to discover the metrics endpoints.
Set up Prometheus monitoring. Prometheus metrics needs to be integrated with New Relic, you can use the Prometheus Agent or the Remote Write integration, see how to send Prometheus metrics.
중요
The Prometheus Agent only scrapes metrics by default from a set of integrations.
In this case, you must identify your pod or endpoint with one of the these labels
app.kubernetes.io/name,app.newrelic.io/name,k8s-appcontaining the stringtraefik.Use the following query to confirm metrics are being ingested as expected:
FROM Metric SELECT count(*) WHERE metricName LIKE 'traefik_%' FACET metricName LIMIT MAXInstall the Traefik quickstart to access built-in dashboards and alerts.
Once you imported, you can edit or clone the assets to adapt them to your specific requirements.
중요
Some charts of the dashboard include queries with conditions that require the identification of your pod or endpoint with one of the these labels
app.kubernetes.io/name,app.newrelic.io/name,k8s-appcontaining the stringtraefik.
Find and use the data
Metrics
Prometheus metrics are stored as dimensional metrics. You can query using NRQL or use the Data Explorer to browse the available metrics, facet, and filter by the associated dimensions.
The different sets of metrics exposed by this integration are defined in the Traefik documentation.
Use the following NRQL queries to understand the metrics being ingested in New Relic:
List unique metric names:
FROM Metric SELECT uniques(metricName) WHERE metricName LIKE 'traefik_%' LIMIT MAXCount number of metric updates:
FROM Metric SELECT datapointcount() WHERE metricName LIKE 'traefik_%' FACET metricNameEstimate data ingestion (daily ingest, in bytes):
FROM Metric SELECT bytecountestimate() WHERE metricName LIKE 'traefik_%' SINCE 1 day ago
Entities
This integration enables Traefik entities powering the full set of entity capabilities such as golden metrics, entity dashboards, workloads, and lookout.
Troubleshooting
Follow the troubleshooting tips from Traefik documentation to make sure that metrics are configured as expected on your cluster.
You can also check the specific troubleshooting guidelines for Prometheus integrations.