New Relic persists select Pixie telemetry data for long-term storage. Find out more about the hybrid storage model for the New Relic Pixie integration here. After install, you can view your Pixie data with our feature.

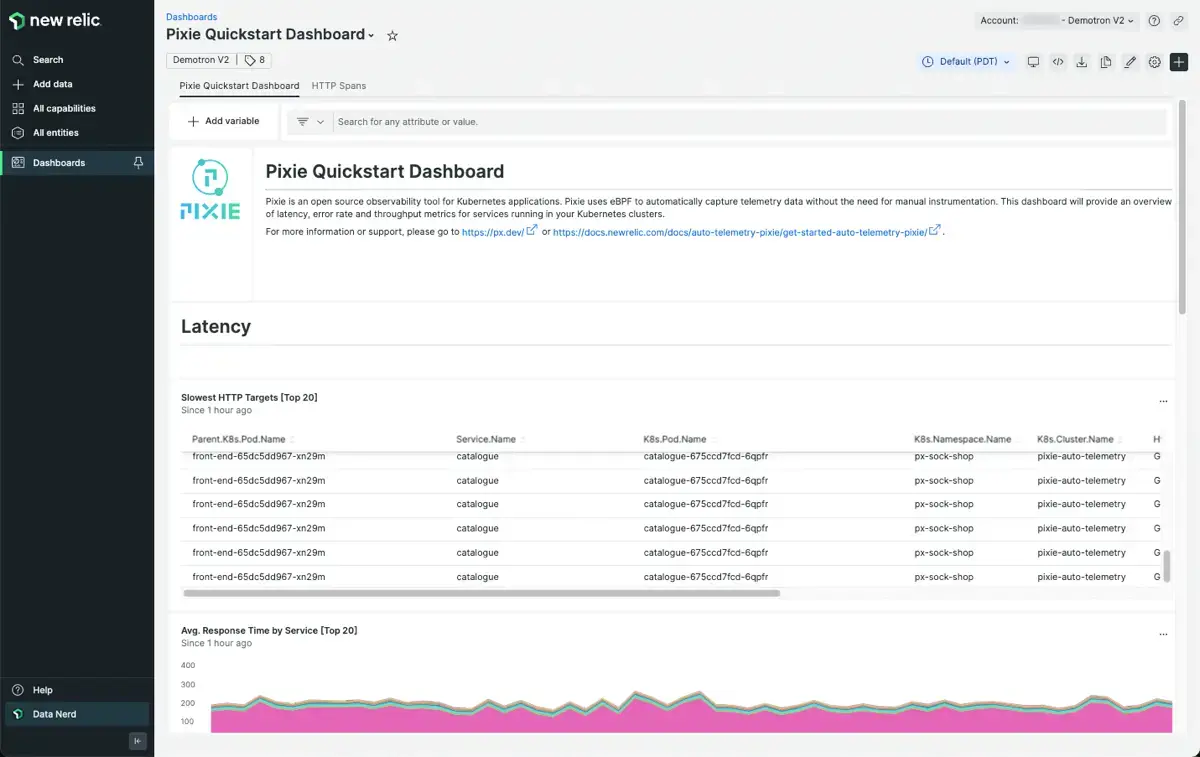
The Pixie Quickstart Dashboard allows you to quickly identify the slowest HTTP endpoints and services, monitor HTTP errors by service and target, and see throughput by service.
Pre-built Pixie dashboards
To install a pre-built dashboard for Pixie data:
- Navigate to the New Relic Dashboards page.
- Select the Browse pre-built dashboards button.
- Search for “Pixie” and pick one of the available options.
- Select the Install this quickstart button.
Custom Pixie dashboards
The visualization widgets in the pre-built Pixie dashboards are populated with data from NRQL queries. Select any dashboard widget’s three-dot menu to view the query providing the data. To learn how to write your own queries for persisted Pixie data, see the Querying Pixie data page.
Find out more information about how to customize a pre-built dashboard or build your own custom dashboard here.