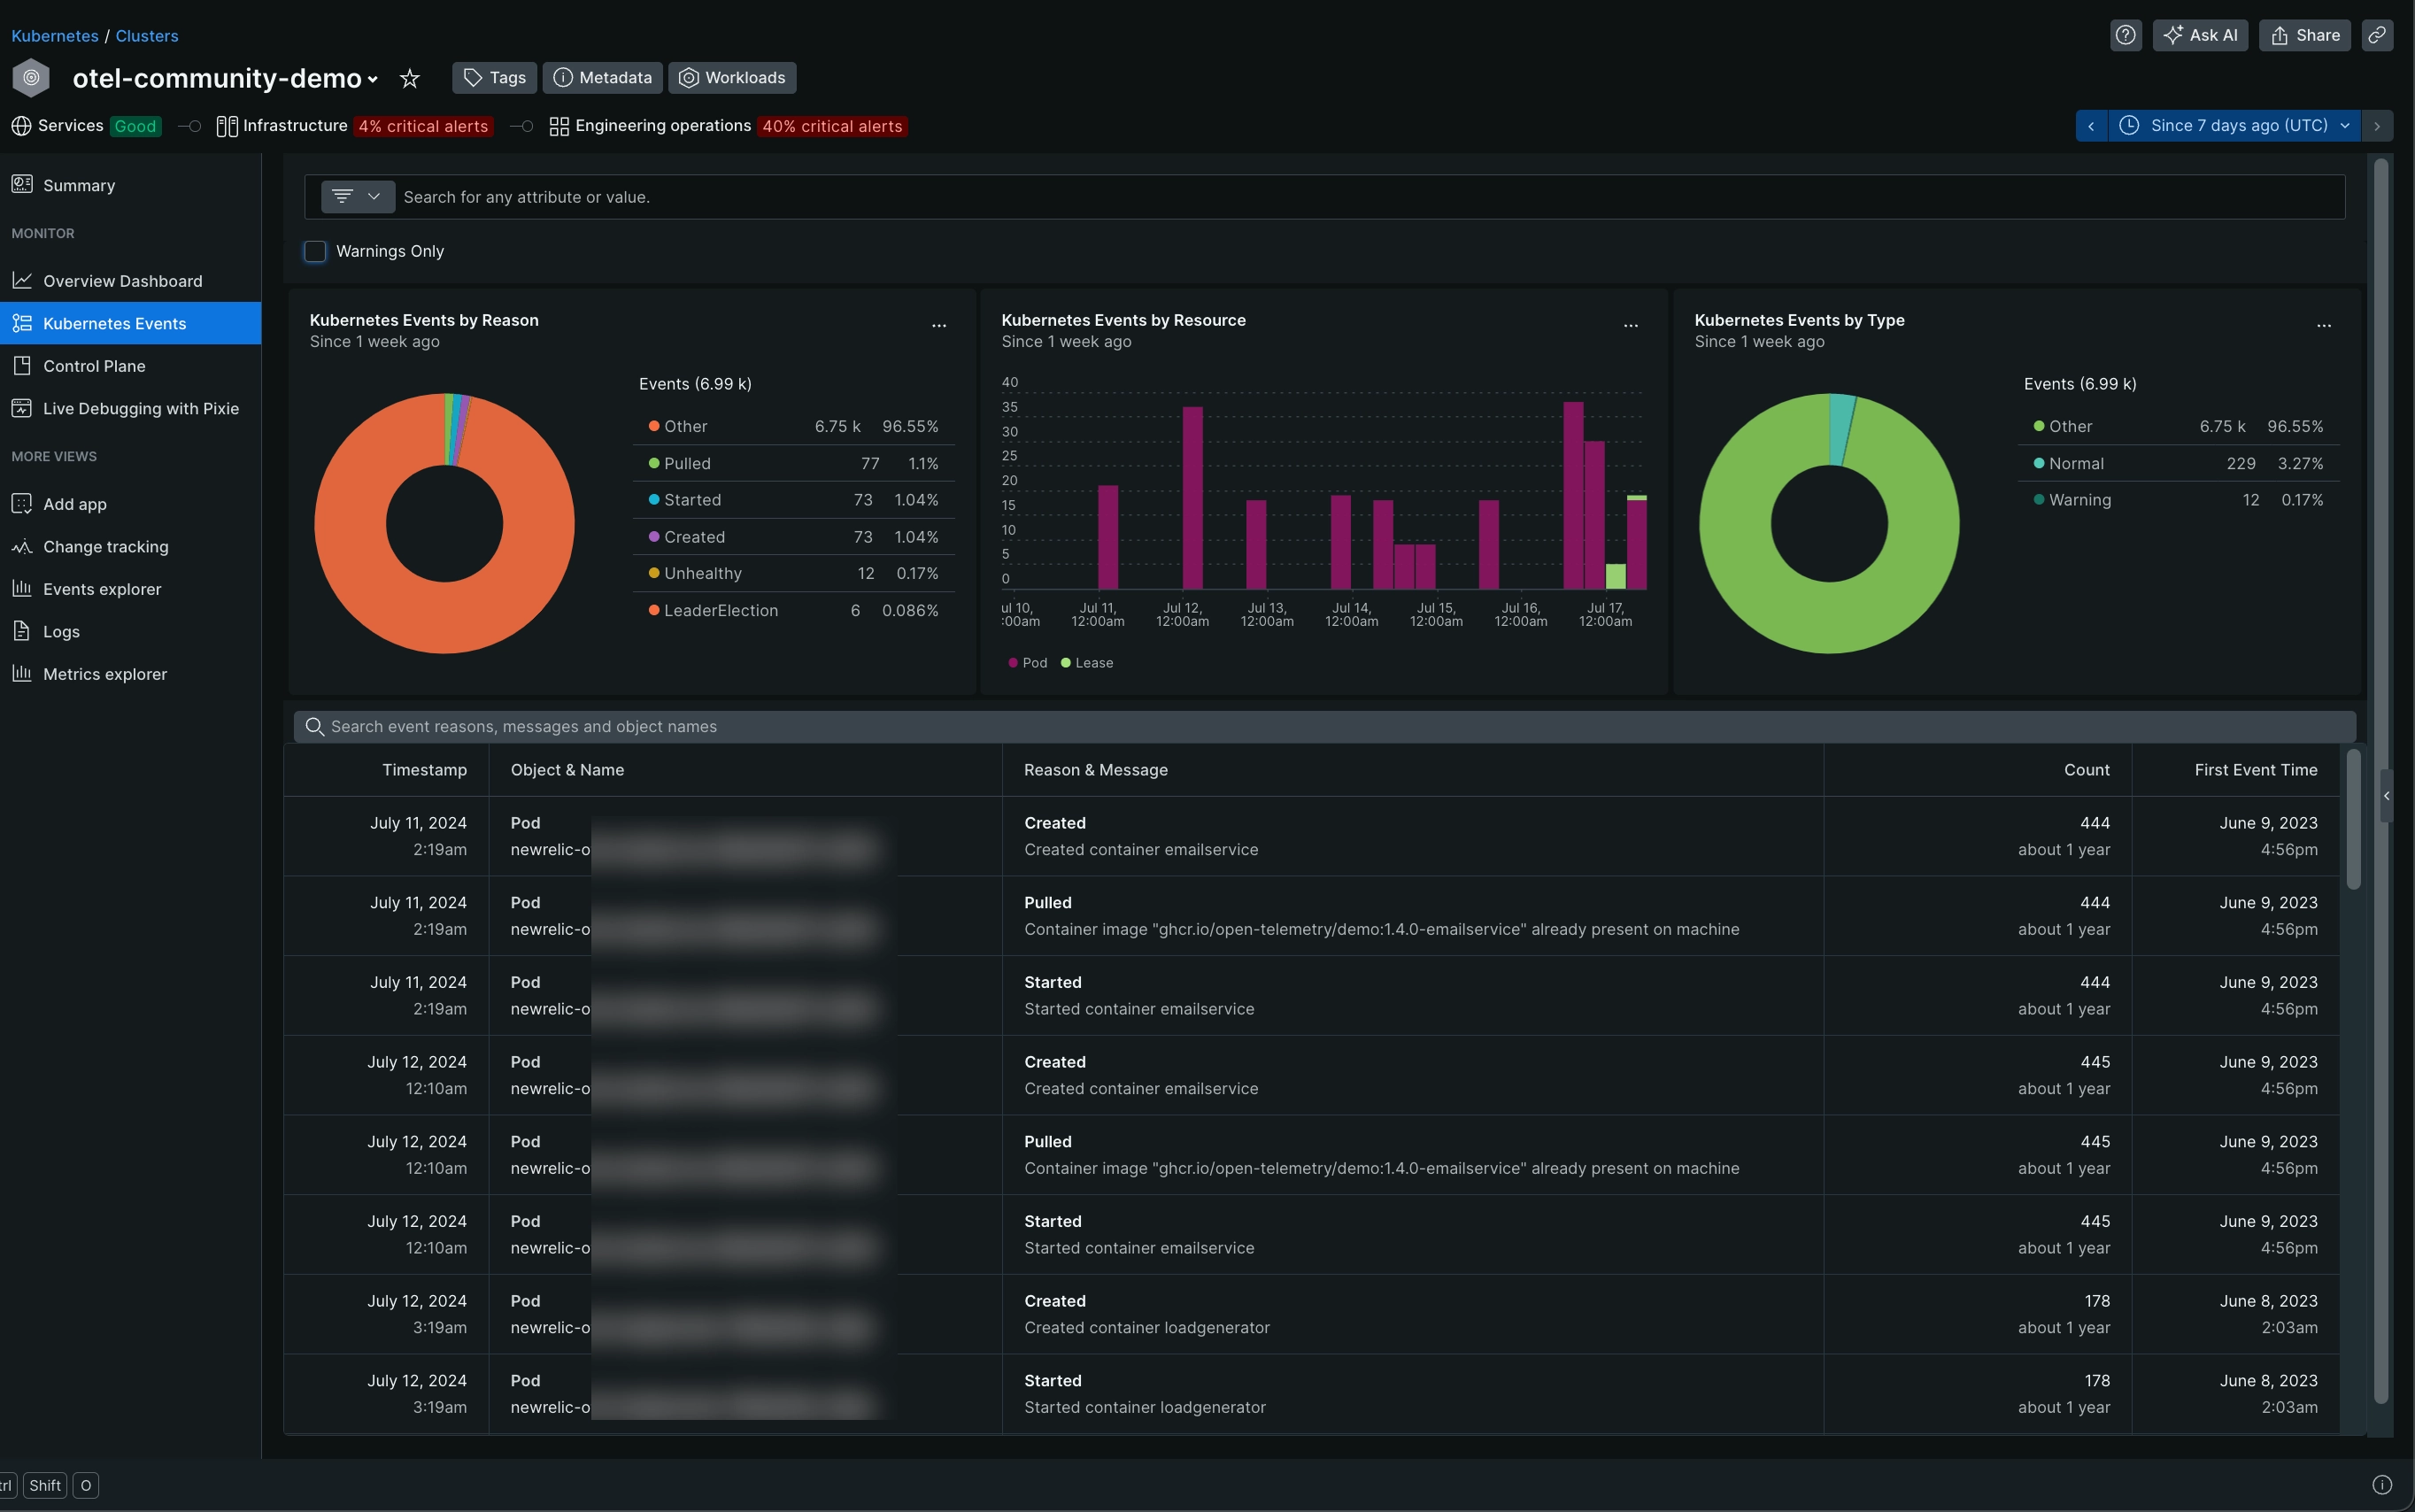
The New Relic Kubernetes events watches for events happening in your Kubernetes clusters and sends those events to New Relic. To visualize your event data, use the Kubernetes cluster explorer, or use the infrastructure events UI.
Find your Kubernetes events
Once you've successfully installed the Kubernetes integration, you can view and query your events in New Relic.
To view your Kubernetes events:
Go to one.newrelic.com > All capabilities > Kubernetes.
Select your cluster.
Click Kubernetes Events in the left navigation pane.

Search events in New Relic
To search events in our infrastructure UI:
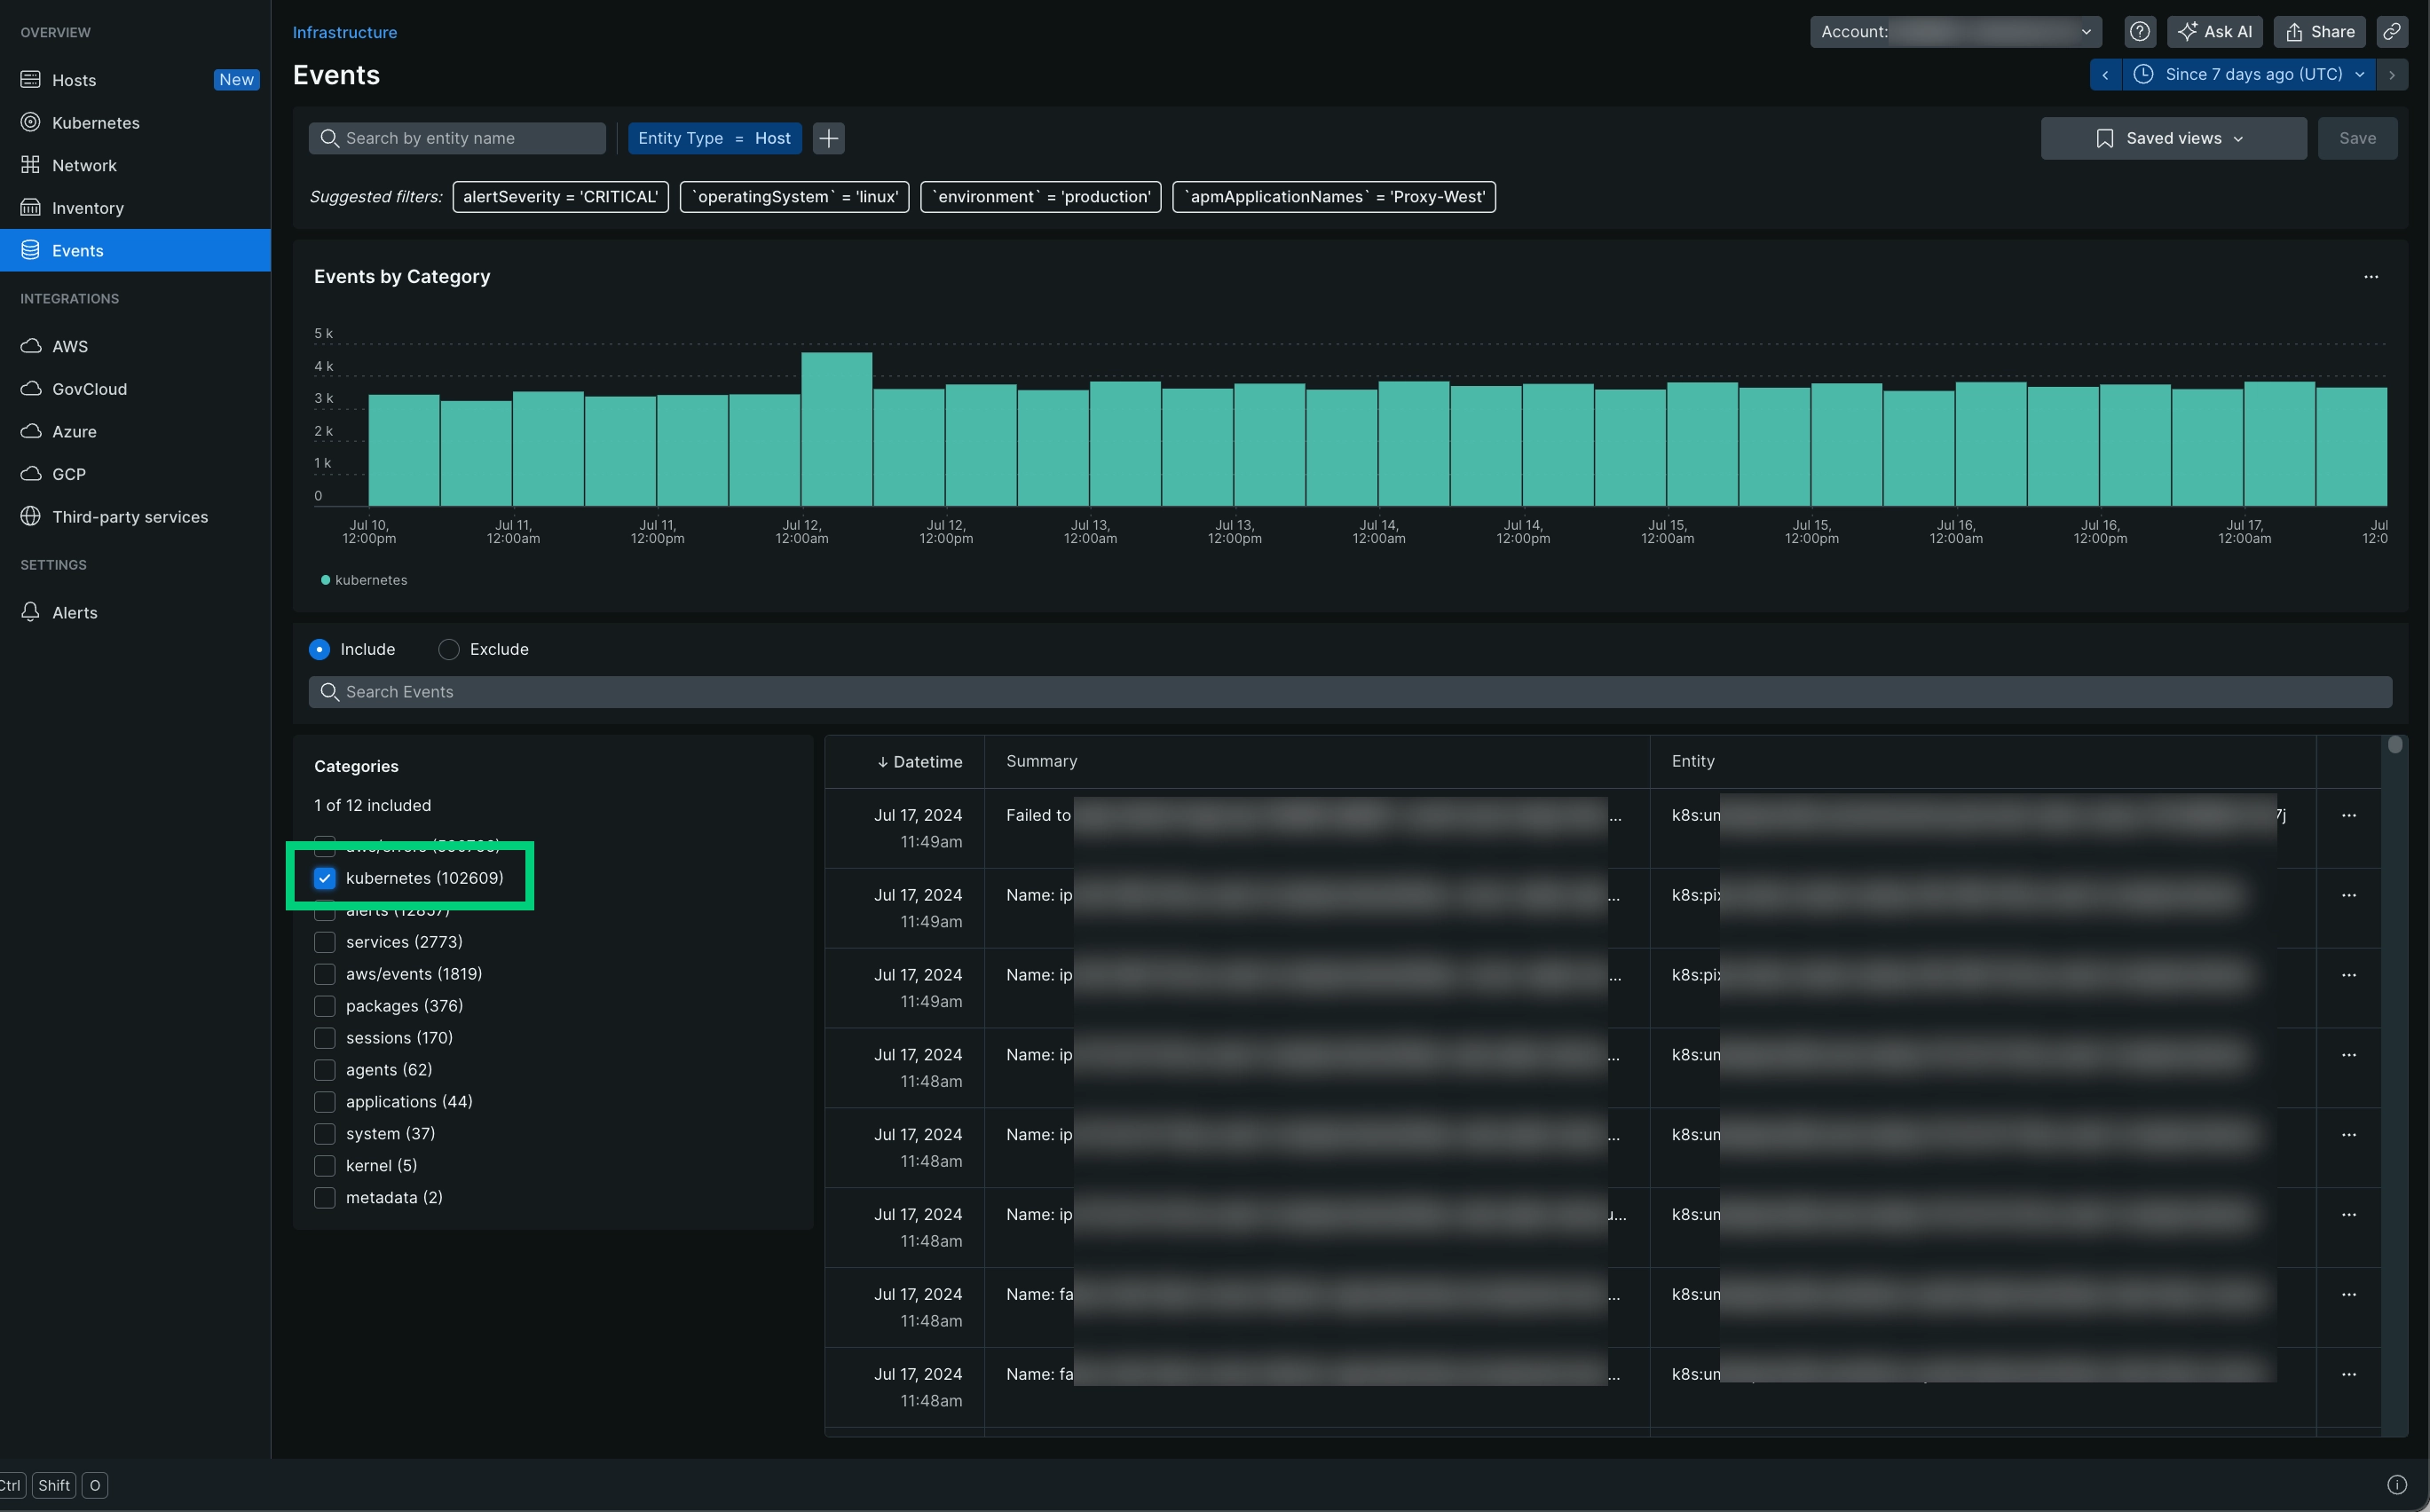
Go to one.newrelic.com > All capabilities > Infrastructure > Events.
In Categories, select kubernetes.
Use the Search events field to look for specific events. To focus on a specific set of events, select or change the filter set.

View events in the Kubernetes cluster explorer
To view events in the Kubernetes cluster explorer:
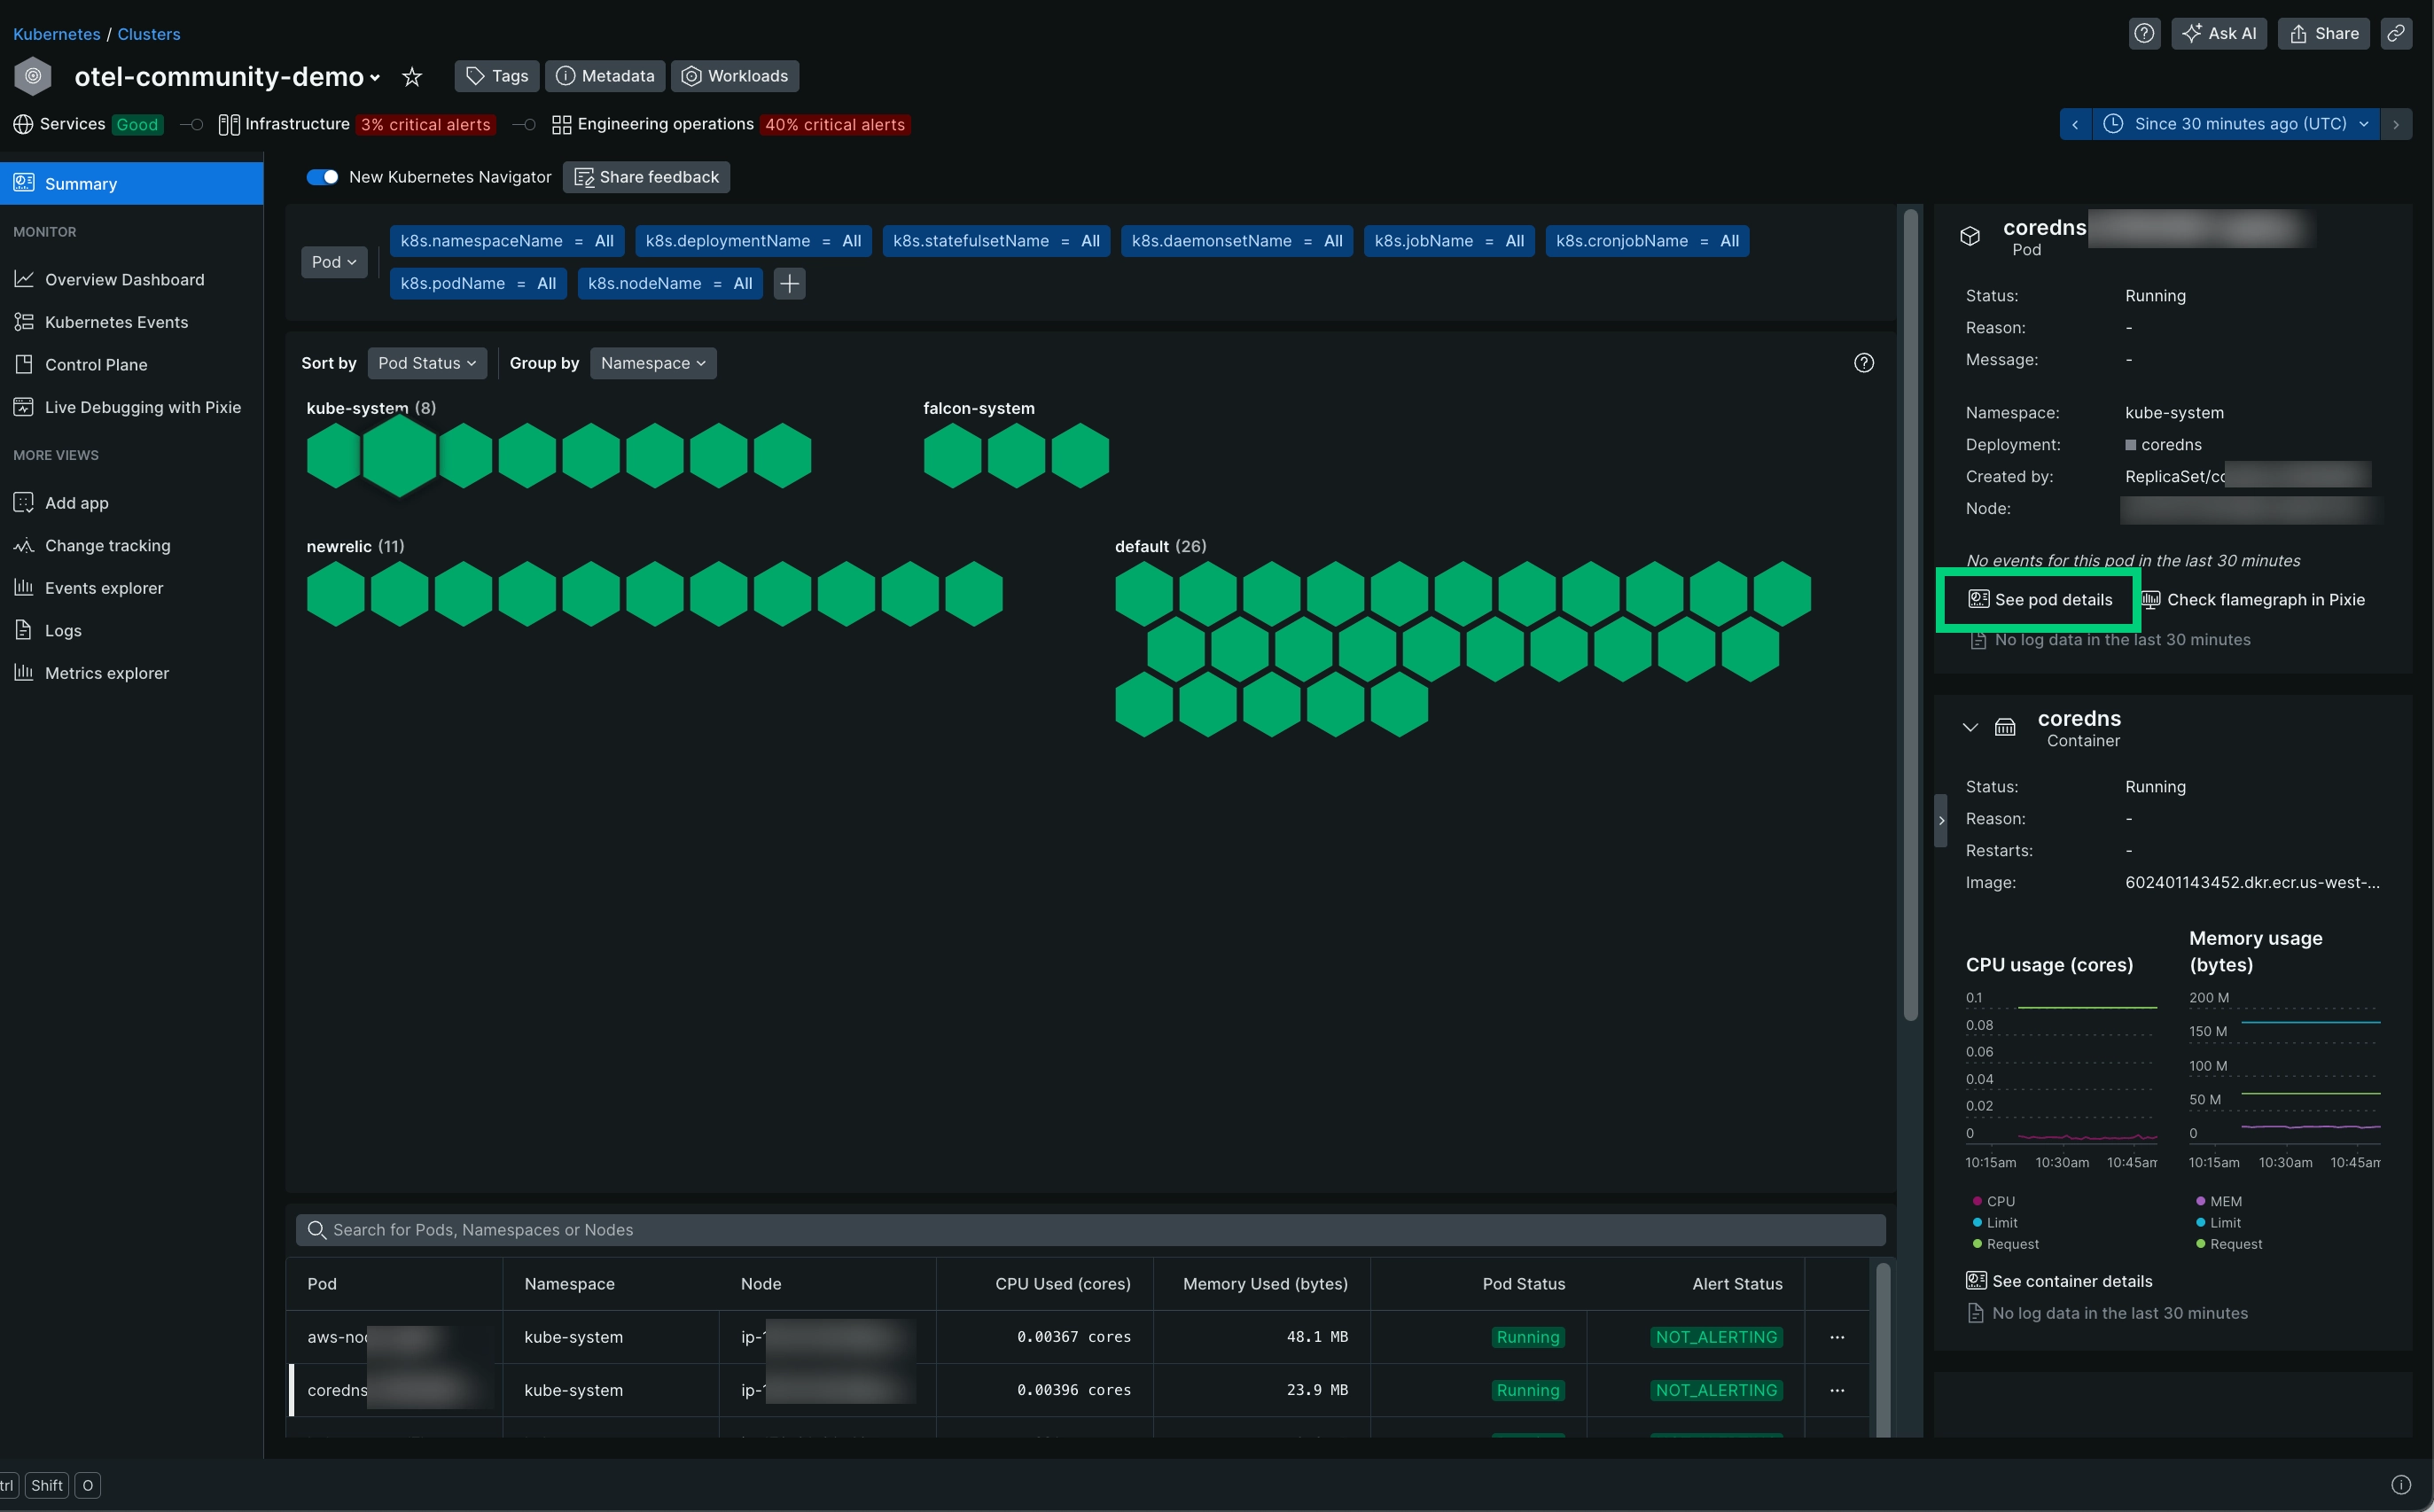
Go to one.newrelic.com > All capabilities > Kubernetes and select your cluster.
Select a pod and click See pod details.

Add events to your dashboard
To add events to your dashboard:
Add a chart to a new or existing dashboard or create a chart using the New Relic query builder.
When creating or updating your chart, select the chart type table and use the following event query, replacing
YOUR_CLUSTER_NAMEwith the name of your cluster:FROM InfrastructureEventSELECT event.involvedObject.kind, event.involvedObject.name, event.reason,event.messageWHERE clusterName = 'YOUR_CLUSTER_NAME' limit 100
Query events
Here are a few examples to query your data:
Get attributes names
To see all the attributes names, use this query:
FROM InfrastructureEventSELECT keyset()WHERE category = 'kubernetes'Get latest event details
To see details about the latest events in a cluster, use the following query, replacing YOUR_CLUSTER_NAME with the name of your cluster:
FROM InfrastructureEventSELECT event.involvedObject.kind, event.involvedObject.name, event.type, event.message, event.reasonWHERE category = 'kubernetes' AND clusterName = 'YOUR_CLUSTER_NAME'The events collected by New Relic will have the exact same attributes as given by Kubernetes. For a reference of these attributes, see the Kubernetes event v1 core documentation.
Optional: Collect metrics of the event collector
To collect metric data for the event collector itself, you need to Send Prometheus metric data to New Relic.
To install and configure the Prometheus agent on Kubernetes clusters:
Install the New Relic Prometheus agent integration.
Label the deployment of your Kubernetes events integration with your configured scrape label (default is
prometheus.io/scrape=true).
Optional: Define custom attributes
To add custom attributes to the events sent by the integration, these need to be specified in your
values.yaml file under the customAttributes map.
For example, to add the attribute environment with value dev to all the events, add the following to your values.yaml:
nri-kube-events: customAttributes: environment: devYou can add other custom attributes globally to all other kubernetes integrations by setting it globally:
global: customAttributes: environment: dev