Our New Relic Ionic Capacitor agent monitors your Ionic Capacitor mobile app and provides deep insights into your app's performance, errors, and user experience. The agent automatically includes New Relic's native agents to provide mobile monitoring and performance visibility. Once you install and configure the agent, you'll be able to:
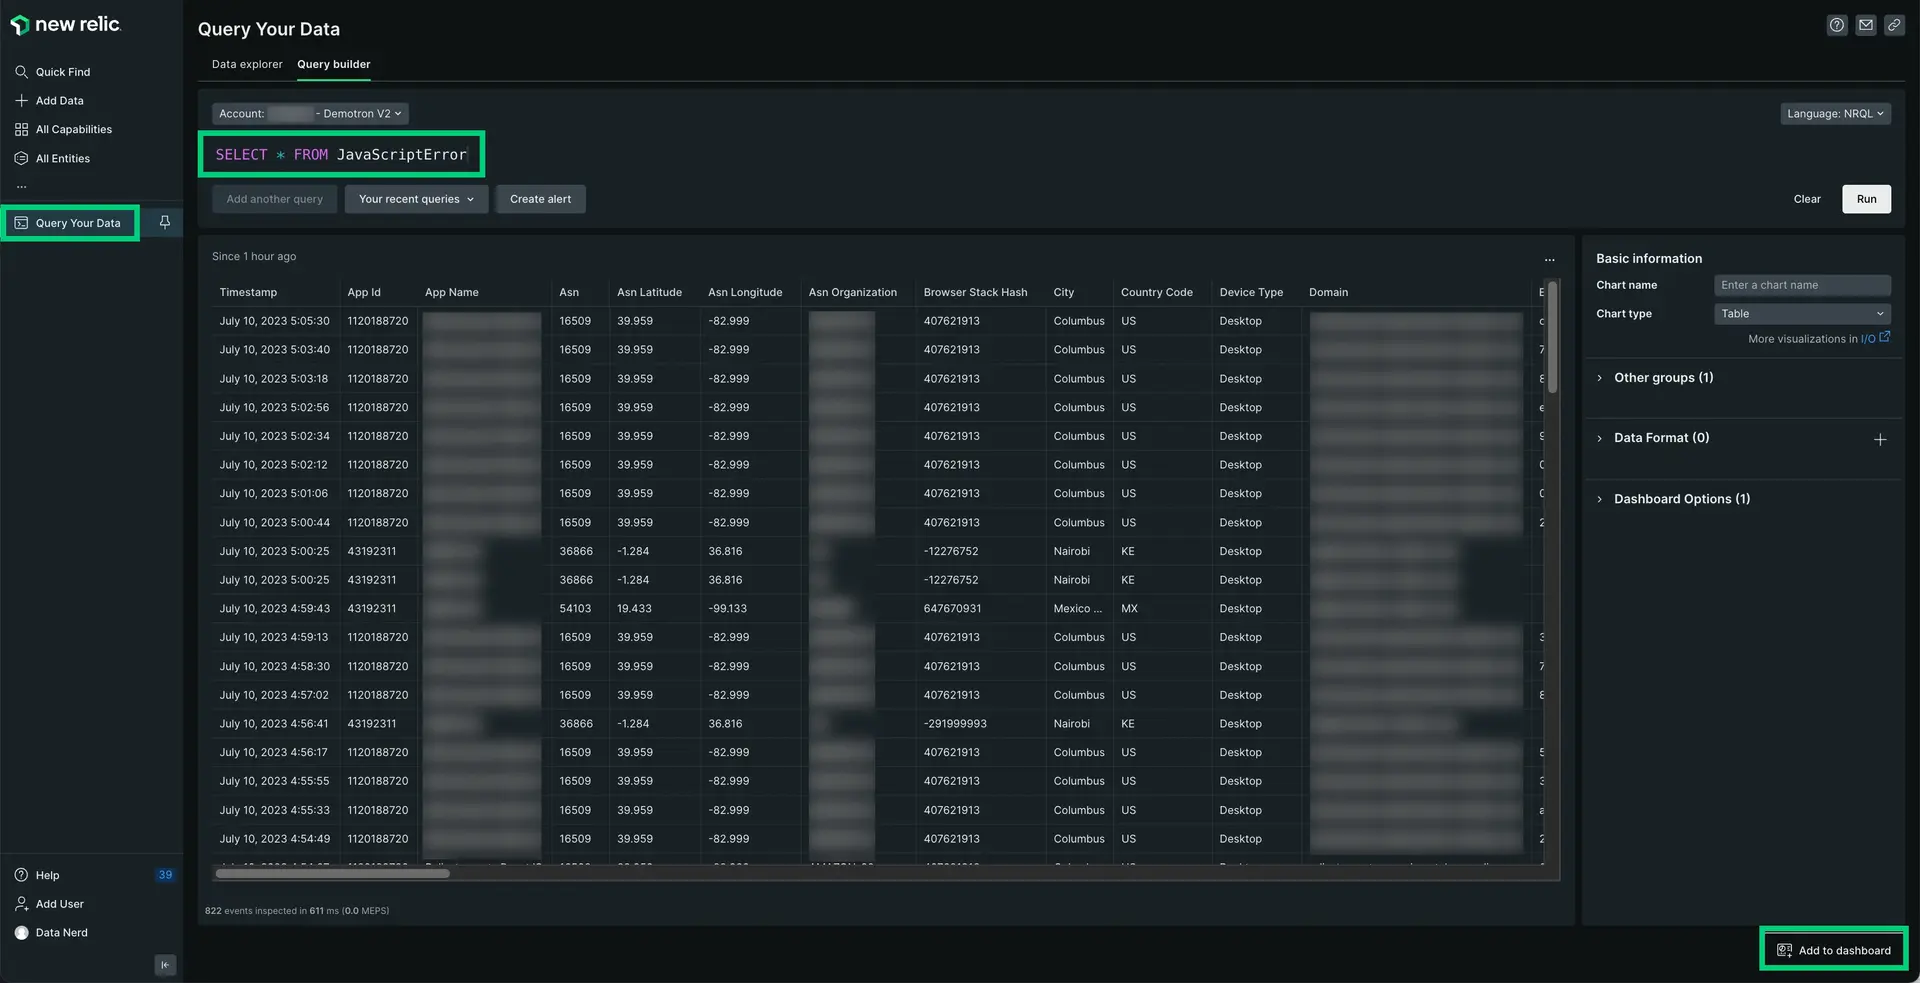
- Capture JavaScript errors: Identify and fix problems quickly.
- Track network requests: See how your app interacts with the backend.
- Use distributed tracing: Drill down into handled exceptions and find the root cause.
- Create custom events and metrics: Understand how your users interact with your app.
For more information, see New Relic Ionic Capacitor agent on Github.
Compatibility requirements
Before you install the agent, ensure your app meets these requirements:
(Recommended) Guided installation
To install the agent, follow our guided install, located directly in the UI.
Manual installation
If you need to install the agent manually, follow these steps:
Create an application token(s)
- Go to one.newrelic.com > Browser & Mobile > (choose Android or iOS), then complete the instrumentation steps in the UI.
- From Step 4 in the UI, copy the application token(s) (one for iOS and Android if applicable).
Add the Capacitor agent
In your project directory, add the Capacitor agent to your project using your command line tool:
$npm install @newrelic/newrelic-capacitor-plugin$npx cap syncConfigure the Capacitor
Start the Capacitor agent in the initialization of your app in
main.ts(Angular or Vue) orindex.tsx(React).Add the following code:
import {NewRelicCapacitorPlugin,NREnums,AgentConfiguration,} from "@newrelic/newrelic-capacitor-plugin";import { Capacitor } from "@capacitor/core";let appToken;if (Capacitor.getPlatform() === "ios") {appToken = "IOS_APP_TOKEN";} else {appToken = "ANDROID_APP_TOKEN";}if (Capacitor.getPlatform() === "ios") {appToken = "IOS_APP_TOKEN";} else {appToken = "ANDROID_APP_TOKEN";}let agentConfig: AgentConfiguration = {// Android Specific// Optional:Enable or disable collection of event data.analyticsEventEnabled: true,// Optional:Enable or disable crash reporting.crashReportingEnabled: true,// Optional:Enable or disable interaction tracing. Trace instrumentation still occurs, but no traces are harvested.// This will disable default and custom interactions.interactionTracingEnabled: true,// Optional:Enable or disable reporting successful HTTP requests to the MobileRequest event type.networkRequestEnabled: true,// Optional:Enable or disable reporting network and HTTP request errors to the MobileRequestError event type.networkErrorRequestEnabled: true,// Optional:Enable or disable capture of HTTP response bodies for HTTP error traces, and MobileRequestError events.httpResponseBodyCaptureEnabled: true,// Optional:Enable or disable agent logging.loggingEnabled: true,// Optional:Specifies the log level. Omit this field for the default log level.// Options include: ERROR (least verbose), WARNING, INFO, VERBOSE, AUDIT (most verbose).logLevel: NREnums.LogLevel.INFO,// iOS Specific// Optional:Enable/Disable automatic instrumentation of WebViewswebViewInstrumentation: true,// Optional:Set a specific collector address for sending data. Omit this field for default address.// collectorAddress: "",// Optional:Set a specific crash collector address for sending crashes. Omit this field for default address.// crashCollectorAddress: "",// Optional:Enable or disable sending JS console logs to New Relic.sendConsoleEvents: true,// Optional:Enable or disable reporting data using different endpoints for US government clients// fedRampEnabled: false,// Optional: Enable or disable offline data storage when no internet connection is available.offlineStorageEnabled: true,// iOS Specific// Optional: Enable or disable Background Reporting.backgroundReportingEnabled: true,// iOS Specific// Optional: Enable or disable to use our new, more stable event system for iOS agent.newEventSystemEnabled: true,};NewRelicCapacitorPlugin.start({appKey: appToken,agentConfiguration: agentConfig,});Make sure you paste your application token(s) into
appToken = ""in the code above. If you deployed your hybrid app to both iOS and Android platforms, you'll need to add two separate tokens: one for iOS and one for Android.
(Android only) If you're monitoring an Android-native app, follow these steps:
Add the following changes to apply the Gradle plugin:
If your project is using plugin DSL, add this snippet:
In
android/app/build.gradle:plugins {id "com.android.application"id "kotlin-android"id "com.newrelic.agent.android" version "7.5.1" //<-- include this}Or, if your project is older, you can use the legacy
newrelicplugin ID by adding this snippet:buildscript {...repositories {...mavenCentral()}dependencies {...classpath "com.newrelic.agent.android:agent-gradle-plugin:7.5.1"}}In
android/app/build.gradle, apply theNewRelicplugin to the top of theandroid/app/build.gradlefile:apply plugin: "com.android.application"apply plugin: 'newrelic' // <-- include this
- To automatically link the package, rebuild your project:bash$# Android apps$ionic capacitor run android$# iOS apps$ionic capacitor run ios
Deploy your app
Then, deploy your app. After some app activity, you should see data in New Relic (it may take a few minutes after deploying your app).
Customize the agent instrumentation
Need to customize your agent instrumentation? Our public mobile SDK API methods let you collect custom data, configure default settings, and more.
The following customizations are available for the Capacitor agent.
If you want to... | Use this method |
|---|---|
Record breadcrumbs to track app activity that may be helpful for troubleshooting crashes. | |
Track a method as an interaction. | |
Record custom errors. | |
Record custom metrics. | |
Record custom attributes and events. | There are several ways to report custom attributes and events:
|
Track custom network requests and failures. | |
Shut down the agent. | |
Enable/disable default mobile monitoring settings. | |
Run a test crash report. |
