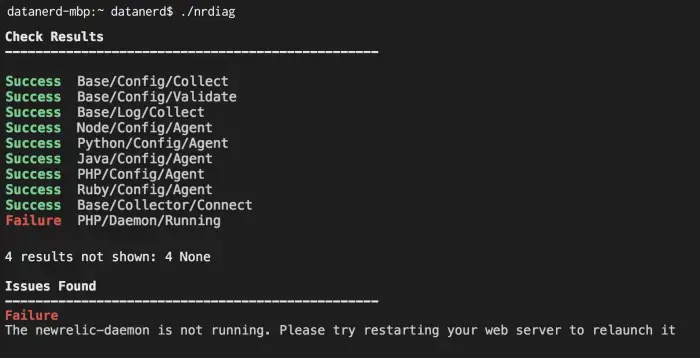
After executing the Diagnostics CLI from your terminal, you will see the results for each task as they are completed. Tasks that result in a Warning or Failure status code will log additional details regarding possible issues found during execution, along with troubleshooting suggestions and relevant links to documentation. If you use the -attach or -api-key flag, you can view your results in the UI

The Diagnostics CLI outputs any issues it found with your installation, along with troubleshooting suggestions.
File output
The Diagnostics CLI outputs three files:
Diagnostics output files | Comments |
|---|---|
| A flattened folder structure with one or more config files and any existing logs from New Relic. Attach this file to your New Relic account. This archive also contains a copy of |
| Output of the individual tests. Attach this output to your New Relic account. |
| A list of files found. The |
Result status codes
The Diagnostics CLI returns the following status codes after running:
Status code | Definition |
|---|---|
| Task successfully executed with no issues detected. |
| Task successfully executed. However, possible issues detected. |
| Task failed with issues detected. |
| Task unable to execute. This could be due to a permissions issues. |
| Task was determined irrelevant to detected environment and was not executed. |
Diagnostics CLI Output in New Relic

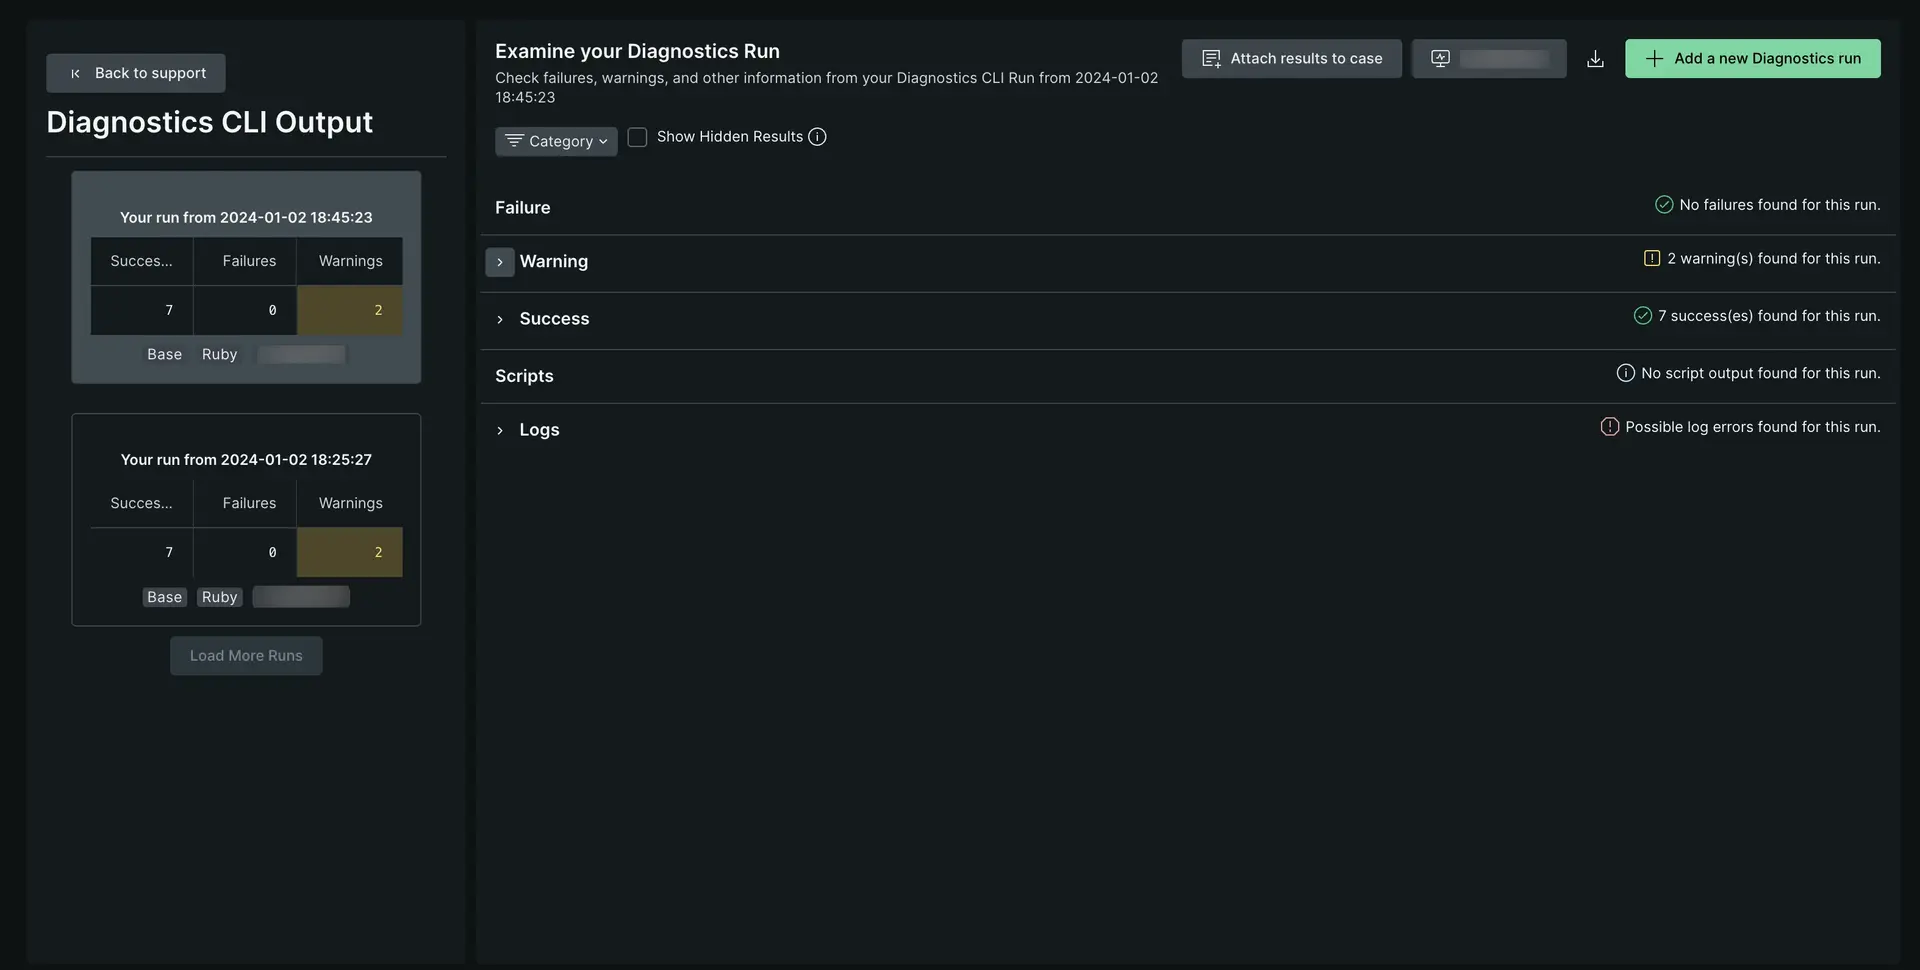
You can examine the nrdiag-output.json output in the UI. The account you select is associated with the license key validated by the Diagnostics CLI or API key that you supplied for upload.
- Click on the question mark in the top right corner in the UI.
- Select the Diagnostics Home tab.
- Under the Diagnostics CLI Output section, click View Run Details.
- This will bring you to your latest run. You can select previous runs on the lefthand side.
- For each run, you'll see the statuses of each task, with warnings and failures as the primary focus. You can also see any logs or script outputs that the CLI found.