Through our UI you can build and share tailored user-friendly charts and visualizations. Go to our dashboard capability to gather and chart the specific data you want to see, the way you want to see it, from anywhere in our platform.
Why it matters
With our dashboards you can customize and understand the data you collect. Explore your data and correlate connected sources with charts and quickly learn the state of your system and applications for faster, more efficient troubleshooting.
Use dashboards to:
- Drive insight with custom, high-density interactive visualizations with a consistent UI.
- Chart all the events and attributes from everywhere across our platform. For more information, see Data collection.
- Add custom attributes or send custom event types to most events in order to better understand your business, and see specific details about how your customers interact with your platform, such as page views, host transactions, etc.
- Manage your charts and dashboards easily using our quick-access CRUD menus and editing options.
- Explore and contextualize data with advanced tooltips and zoom-in functions to monitor what your systems are doing in real time.
- Search your dashboards for attributes and metrics.
- Report custom data to New Relic and your dashboards from any source.
- Share dashboards with stakeholders outside your New Relic organization via publicly accessible live dashboard URLs.
Get started with dashboards
Go to one.newrelic.com and click on Dashboards.
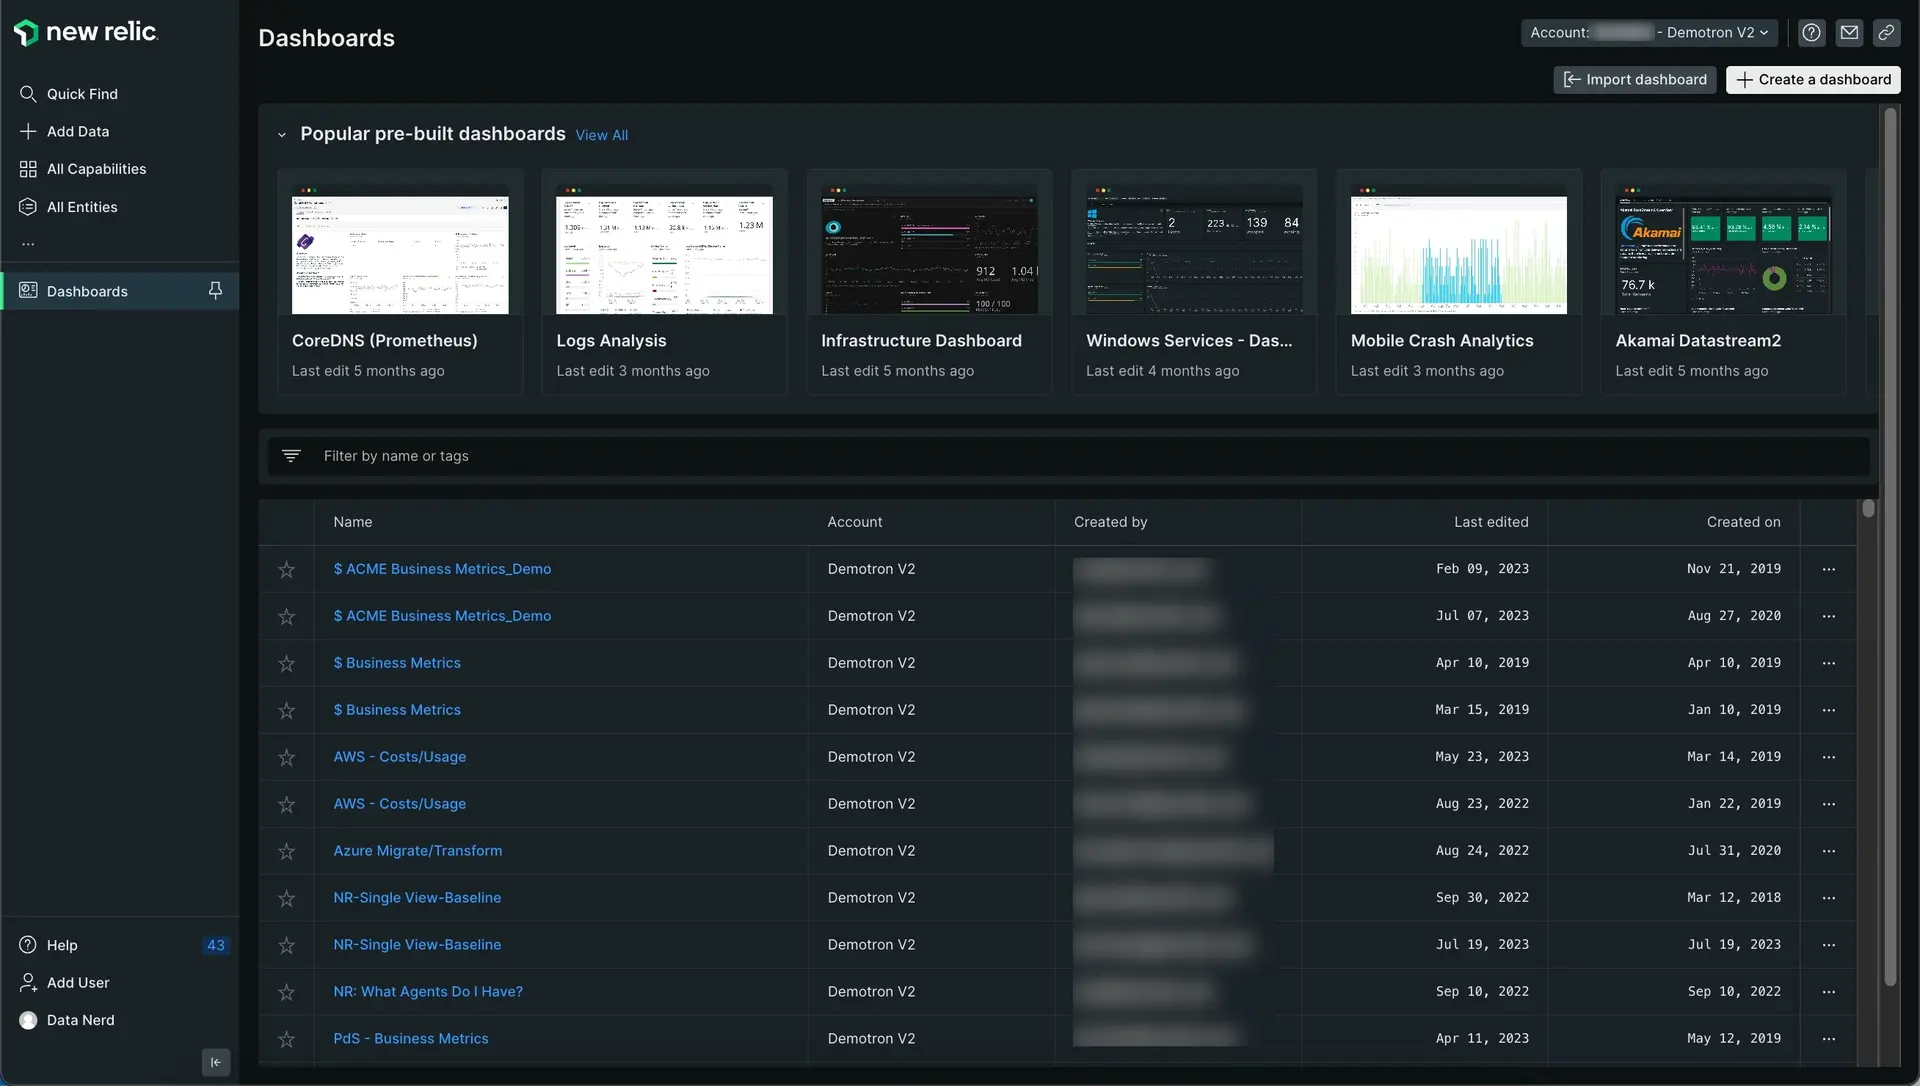
In the dashboards index, you can view all the dashboards and data apps associated with your New Relic account. You can also view the popular pre-built dashboards.

Go to one.newrelic.com > All capabilities > Dashboards to open the Dashboard index.
For each dashboard, the index displays the following information:
- Favorite status, indicated by a star
- Name: The name of the dashboard
- Account: The account the dashboard belongs to
- Created by: The user who created the dashboard
- Last edited: When the dashboard was last modified
- Created on: When the dashboard was created
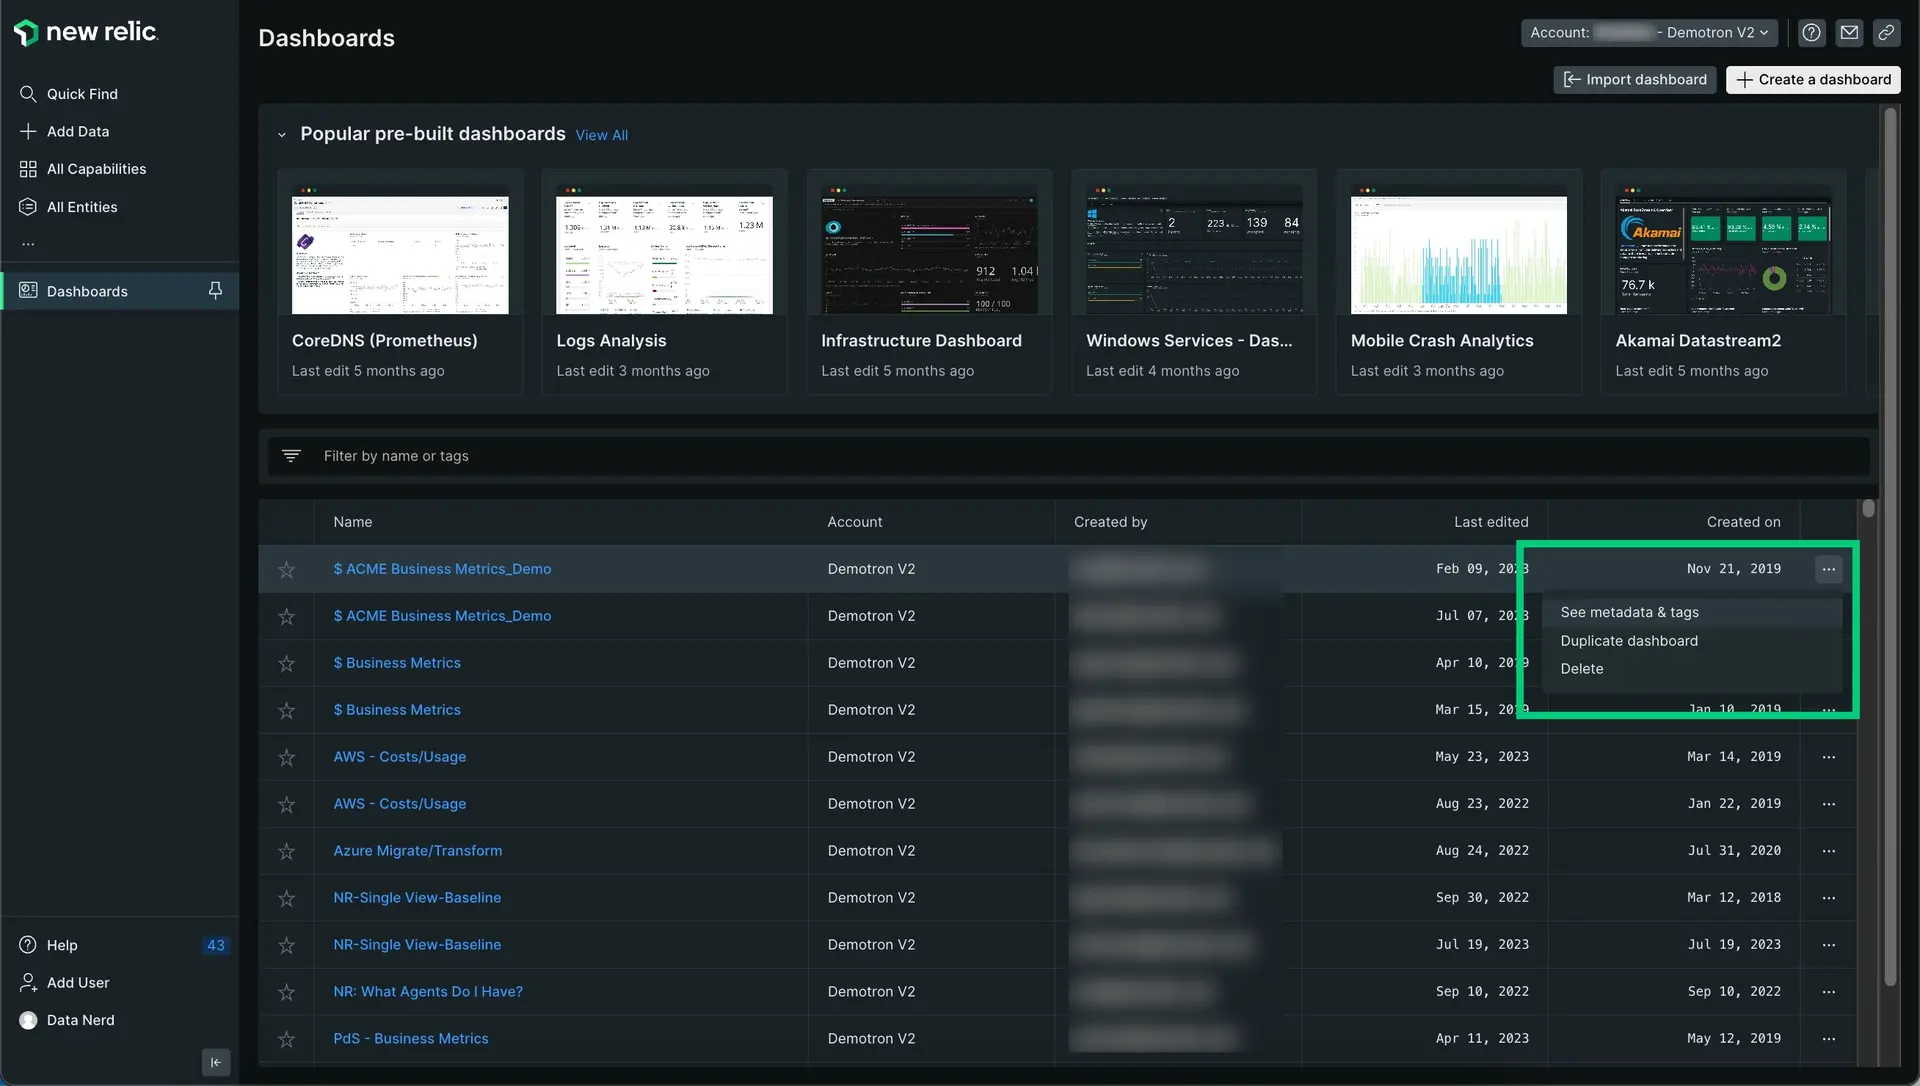
Here you can carry out the following actions:
Dashboard permissions
- Account association: Every dashboard is a resource that belongs to the account in which it was created. This association does not change. If the account to which it belongs is canceled, any dashboards within it will no longer be accessible.
- User ownership: The user ID that creates a dashboard is its owner. Ownership determines who has the right to manage the dashboard's permissions.
For example, If the owner user ID is deleted, the dashboard is not removed from the account it belongs to. It persists with its last-known permissions, but because the owner is gone, those permissions can no longer be managed or changed. The solution to this would be to duplicate the dashboard and the user that does that will be the owner of the duplicate. The dashboard that was duplicated can then be deleted.
Dashboards have three types of permissions:
- Edit - everyone in account: All users have full rights to the dashboard.
- Read-only - everyone in account: All users are able to see the dashboard, but only you've full rights to work with the dashboard. Other users can access the dashboard but are not able to edit or delete it, although they can duplicate it.
- Private: Only you can see the dashboard. Everything but the metadata is hidden.
When you create a dashboard using the Create a dashboard button or by duplicating another dashboard, it will have Edit - everyone in account rights by default. Later, you can change them from the settings menu once you access the dashboard.
Create and manage dashboards via API
You can use our NerdGraph API to create and manage dashboards. Our API gives you access to more features than the UI: for example, you can create dashboards with data from multiple accounts.
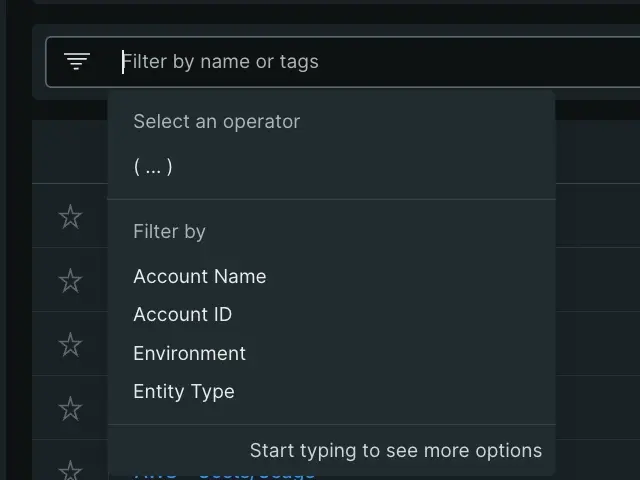
You can also add tags with NerdGraph. You can filter your dashboards using tags, which can be helpful to identify users, accounts, locations, and more.
팁
Do you use Datadog to monitor your infrastructure and want to try out New Relic's monitoring capabilities for free? See our guide on how to migrate from Datadog to learn how.

