The first step to improving your stack is understanding your data. Once you've started ingesting data using one of our APM agents, you need to organize all the information that is now funneling directly from your application to New Relic. You can monitor metrics, events, logs, and transactions by creating custom data visualizations with NRQL, our New Relic query language. But sometimes you don't have time to build the exact dashboard you need, or you might not even know what data you should be monitoring. We have a collection of recommended pre-built dashboards to help you instantly visualize your data for common use cases.

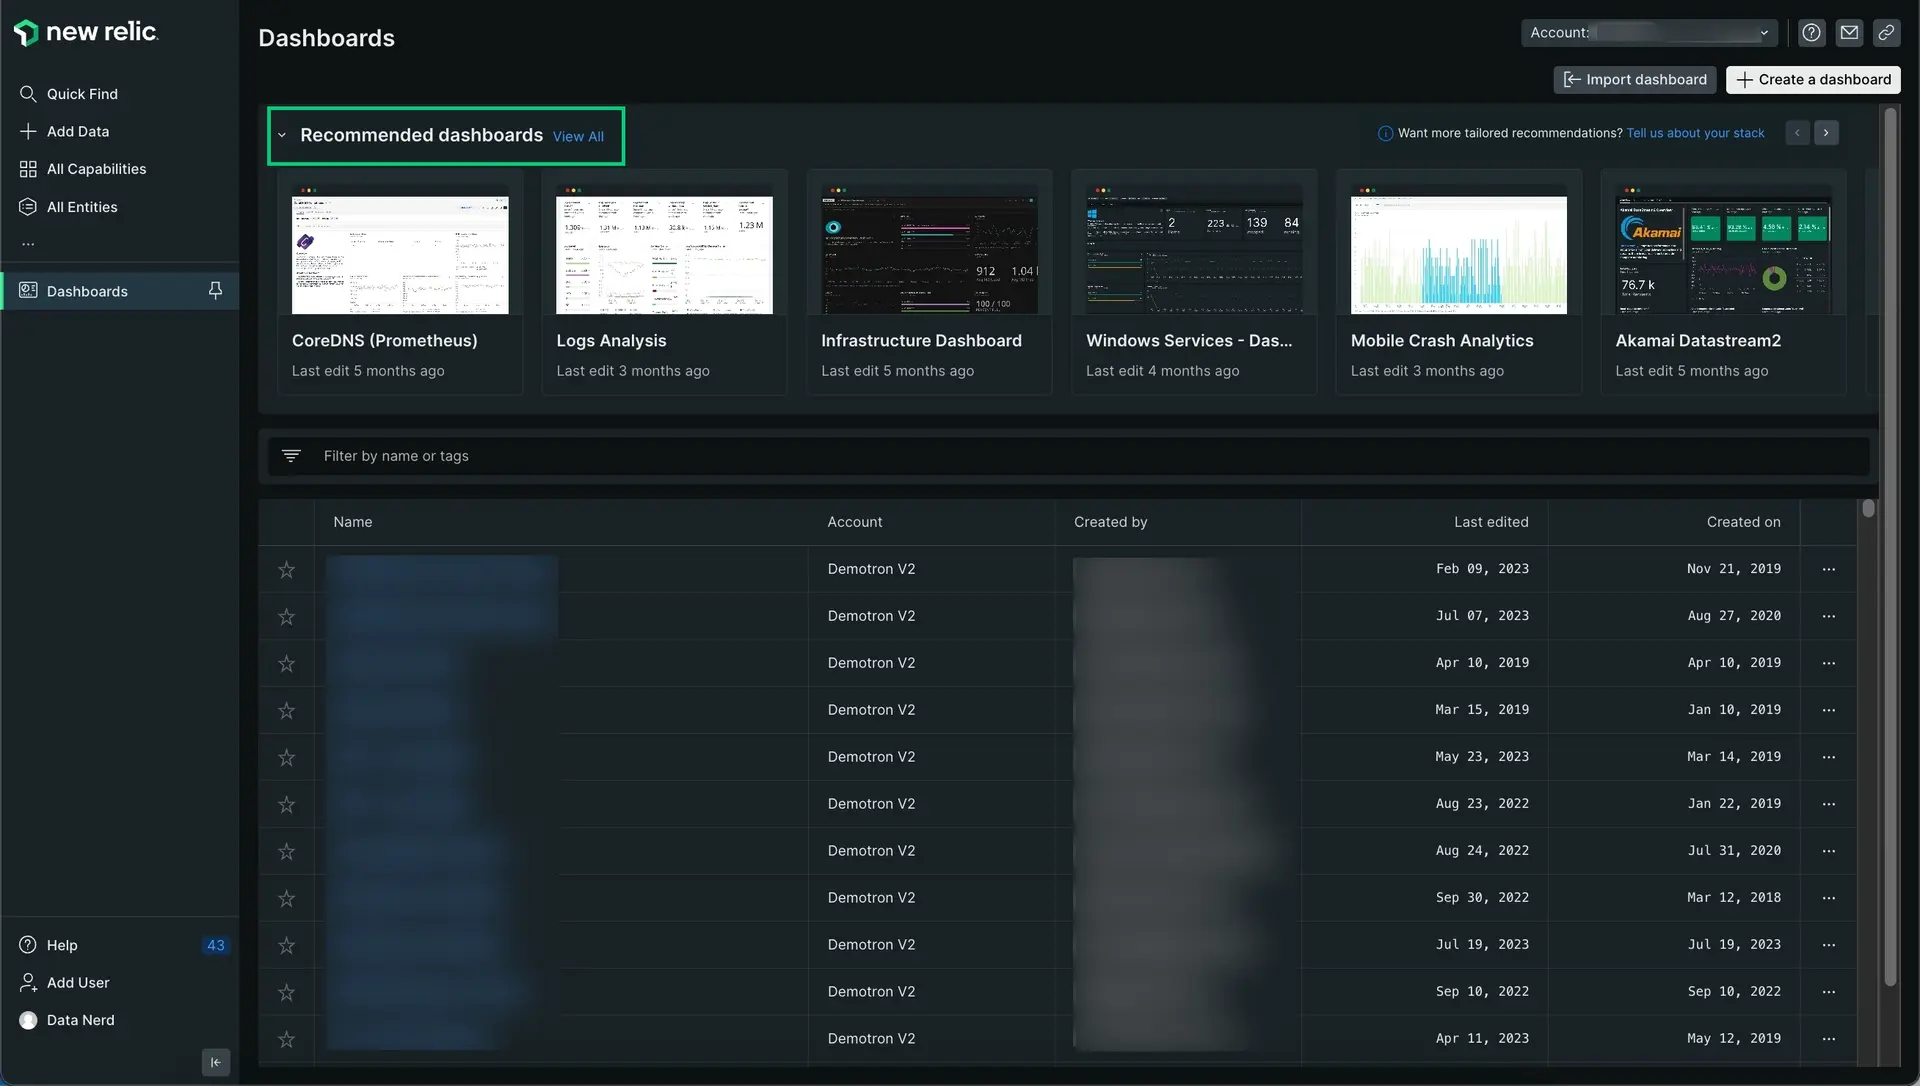
Go to one.newrelic.com > All capabilities > Dashboards to open the Dashboard index.
Dashboards tailored for your stack
To make full use of every tool New Relic has to offer you can install pre-built dashboards that fit your business needs. If you run an ecommerce site and you want to understand any potential revenue risk, you can install the dashboard Customer experience bottom of the funnel analysis which automatically monitors orders, checkout, latency, and tracks promotions. Or if you're a DevOps engineer and you want to make sure your hosts and servers don't get overwhelmed, you can install our Infrastructure Dashboard to quickly analyze CPU and memory and make changes.
Connect your data
It's important to instrument your data sources before using our dashboards. If you're just starting out, follow these instructions. If you already have everything you want to monitor connected to New Relic move on to the next step.
To monitor your application's performance, you'll use an agent created specifically for your app's language. Clicking a logo sends you to New Relic platform where you'll be guided through installing and configuring the agent.
Once you've installed an agent, go to one.newrelic.com and select your app. If you don't see much data just yet, step away for a while and let the agent gather real-time data as your application runs.
Tell us about your stack
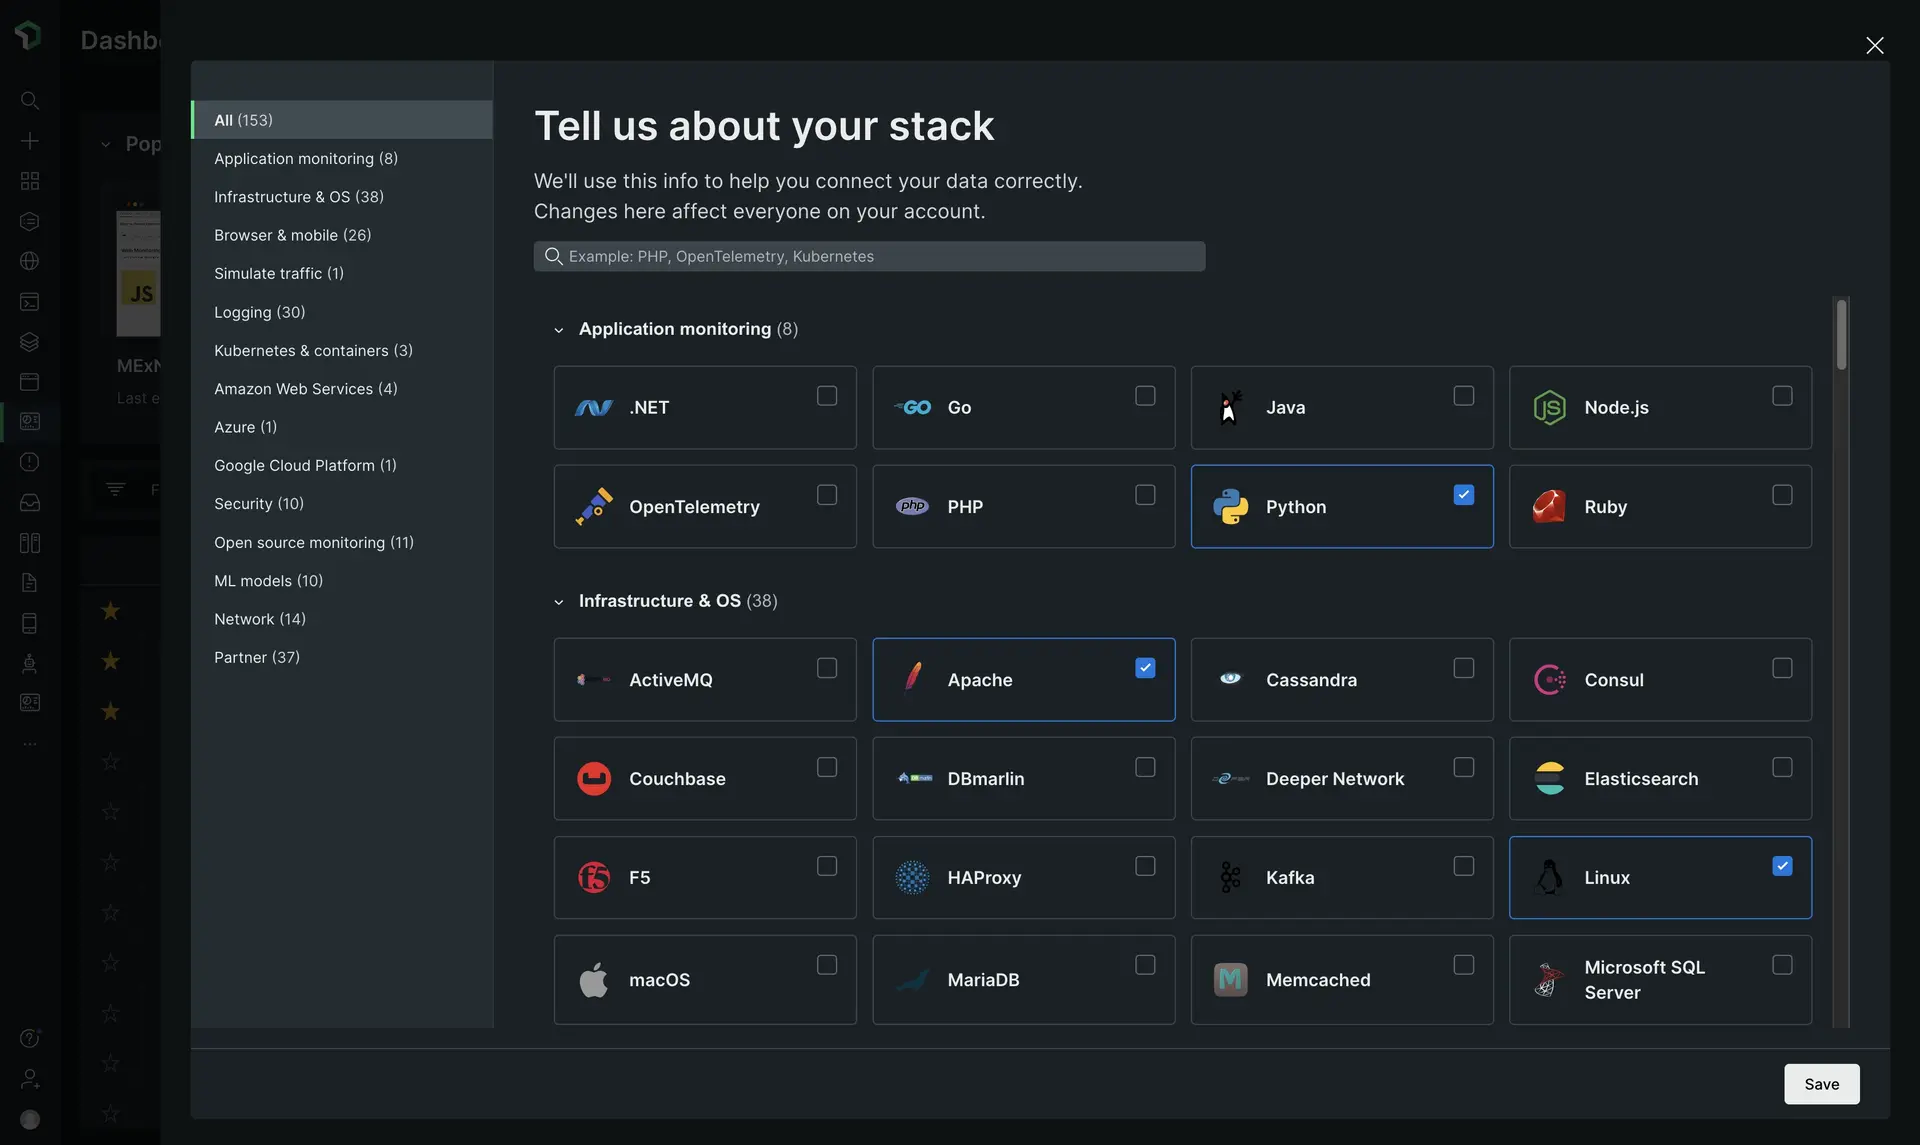
We will always recommend dashboards we think might be a good fit for your team but if you're looking for a tailored experience that highlights specific dashboards that target your application's unique needs, we recommend telling us a little about how your stack was built.

- Go to one.newrelic.com > All capabilities > Dashboards.
- Select your account in the top right account picker.
- Search for the pre-built dashboard subsection.
- Click
Tell us about your stack. - Change your stack configuration by selecting all applicable choices like
apacheornode.js. - Save your changes.
- New recommendations will now appear on your dashboards homepage.
Install pre-built dashboards

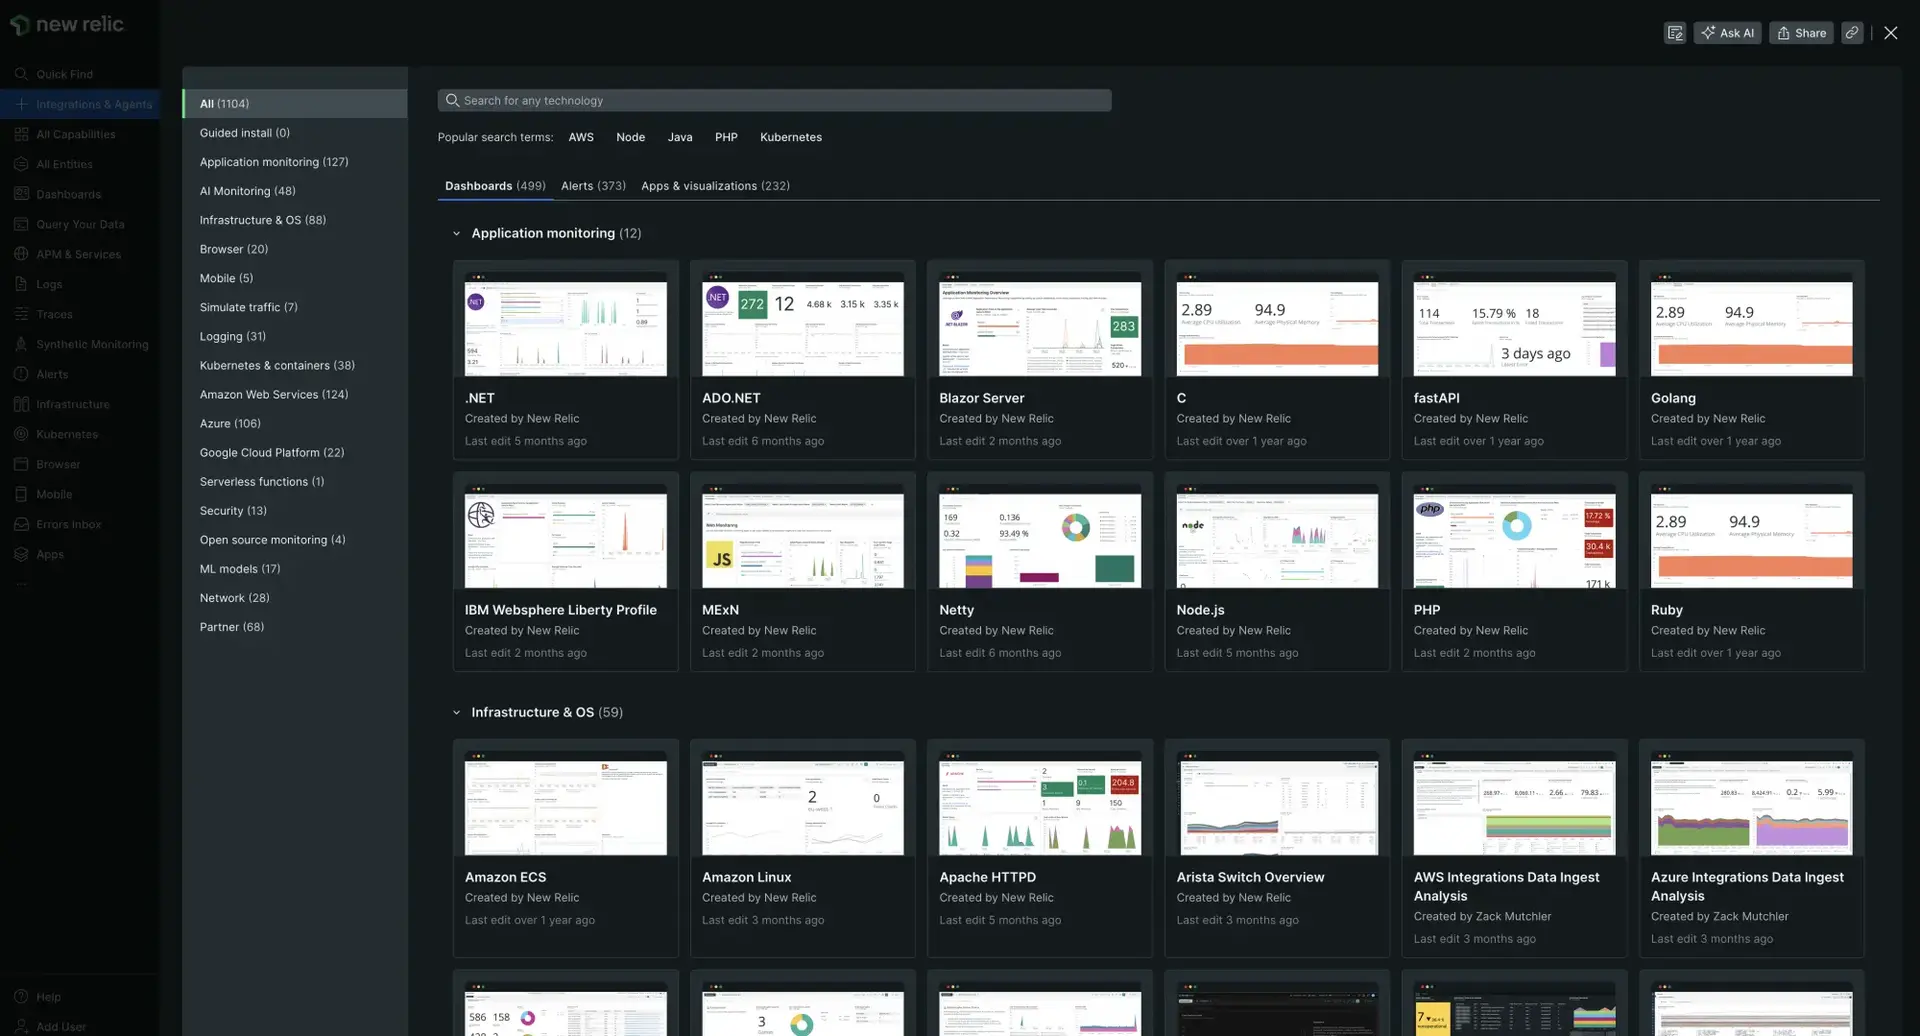
Go to one.newrelic.com > All capabilities > Dashboards to open the Dashboard index and click the View All link to see all the pre-built dashboards on the Integrations & Agents page.
To install a pre-built dashboard:
- Select your account in the top right account picker.
- From the dashboards page, search for the pre-built dashboard you want to customize.
- Click the pre-built dashboard to select it. A new dashboard setup window should appear.
- Follow the instructions. If you've already instrumented the data source, you can skip this step.
- Click View dashboard to deploy the dashboard and start visualizing your data. Note that you can customize your new pre-built dashboard (see Manage your dashboard). You can also change the name and settings, add new content and new widgets, and refine the charts
Optional: view more templates
Browse the entire dashboard catalog to find out-of-the-box dashboard templates for all available integrations. Click the View All link next to the Recommended dashboards title to see and search for all the available pre-built dashboards. You can use the and buttons to browse more pre-built dashboards.
When you click the View All link, the Integrations & Agents page opens.

Go to one.newrelic.com > All capabilities > Dashboards to open the Dashboard index. Browse popular pre-built dashboards you want to install using the and buttons, or select the View All link to see the entire catalog.
You can find hundreds of pre-built dashboards. You can use the tabs labelled: datasources, dashboards, alerts, and apps & visualizations.
팁
The top banner of the Integrations & Agents page shows gaps in your monitoring. Our infrastructure agent automatically discovers services, applications, and log sources running in your environment. It also guides you through installation to help you get full visibility of your stack. Select the See gaps link to get started.