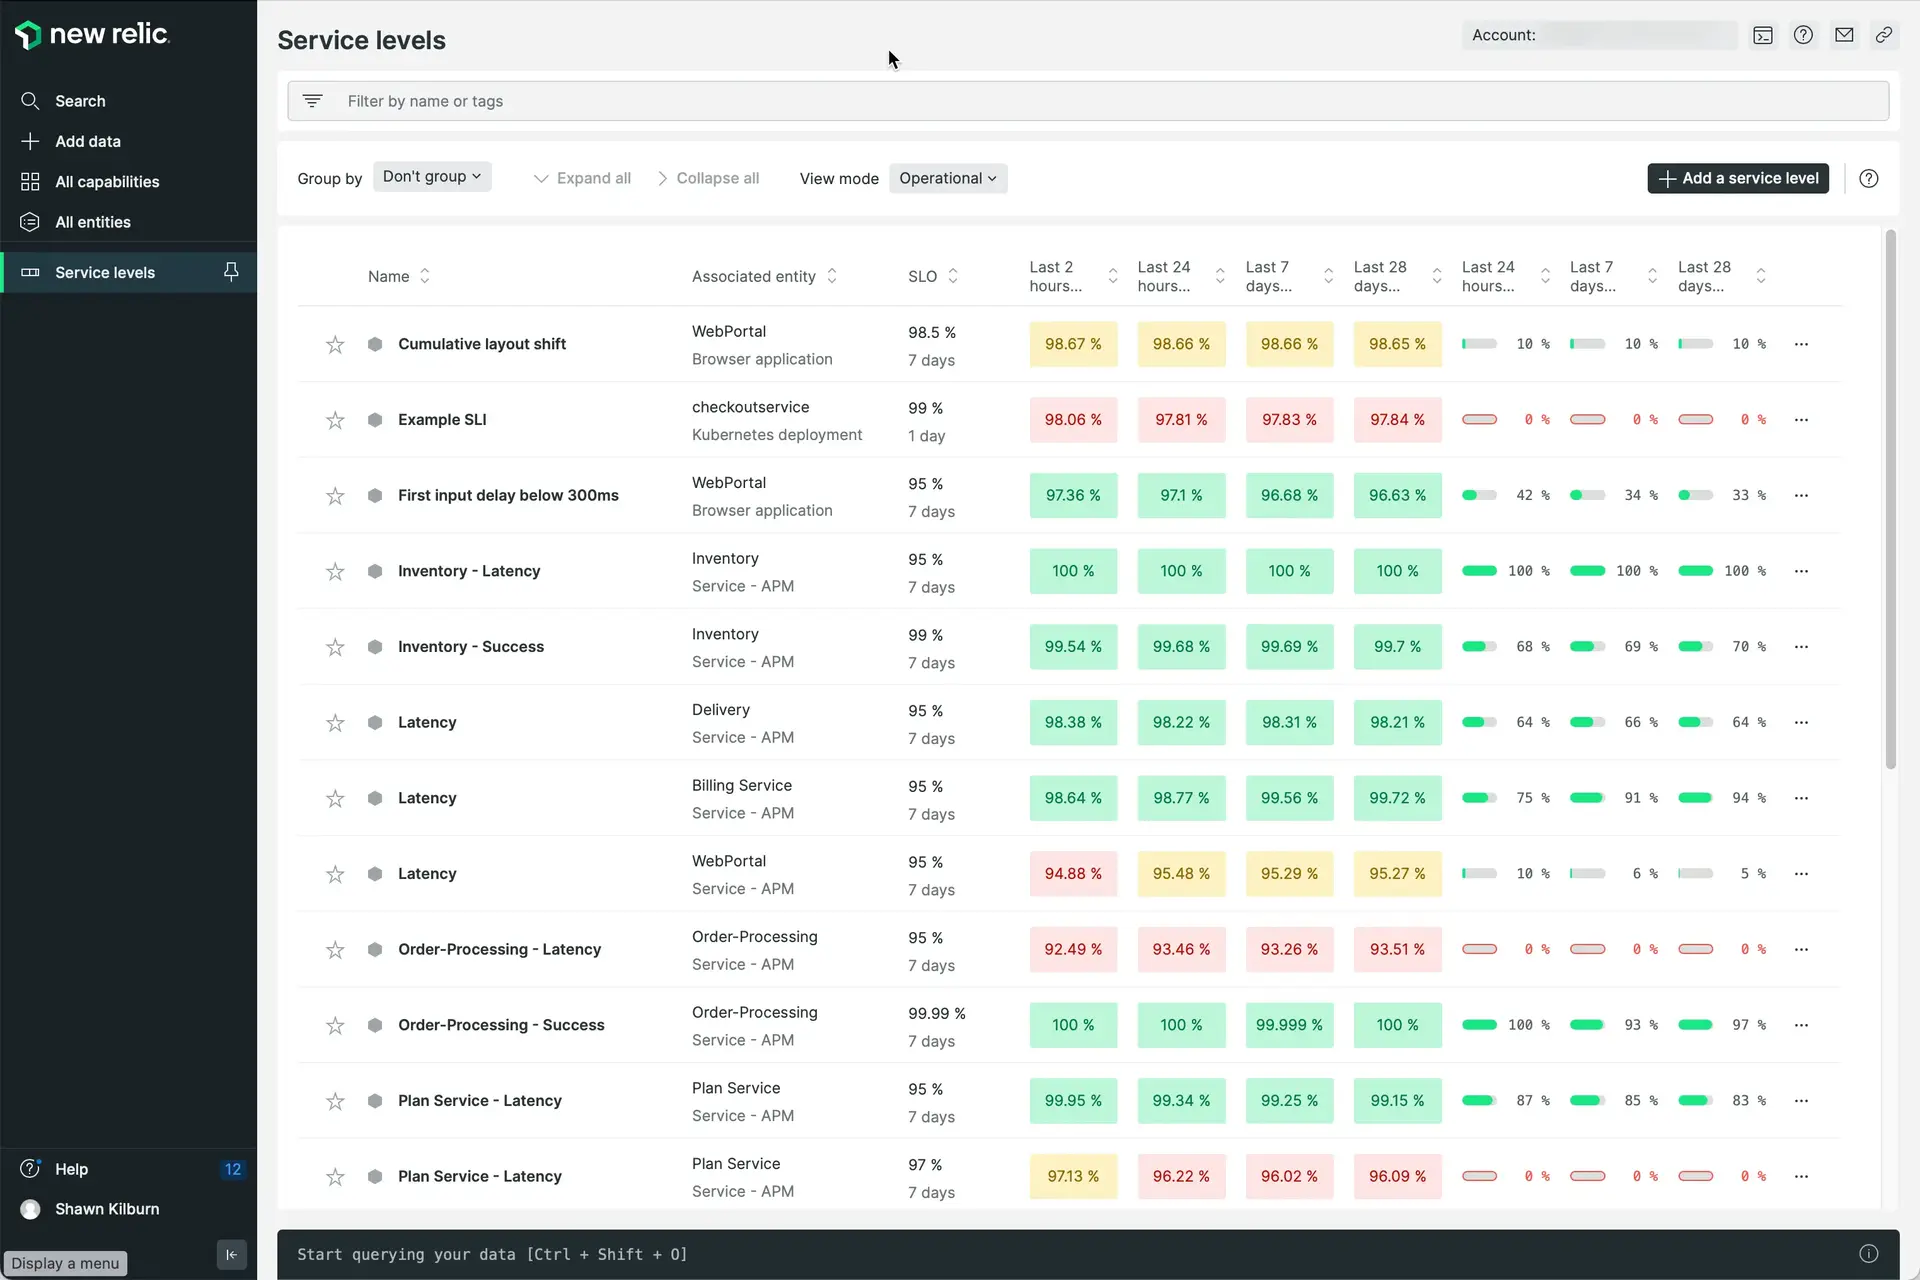
Service levels were popularized by Google and became a best practice in the industry. Service levels complement existing monitoring by adding a perspective more focused on the business and the user experience.
With New Relic, you can define and consume service level indicators (SLIs) and service level objectives (SLOs) for your applications. There are several relevant reasons to configure and follow your New Relic service levels:
- Easy creation: facilitates creation of service levels with different modes of complexity, from one-click to advanced modes fully customizable for advanced users.
- Integrated with New Relic experiences: visualize and work with services levels in Navigator, Workloads, mini overview and through most of the New Relic observability tools.
- Alerts support: create that warn you of any degradation that you should pay attention to.
- Analysis tooling: analyze the reliability status of all systems in a consistent way. The Period over Period view mode allows you to spot trend changes in any service level. Additionally, whenever a Service Level is breached, the summary view allows you to check potential causes of the issue.
- Capacity planning: create service levels to find your app baselines. When you're preparing for a peak demand event, service levels can help your team succeed.
What are SLIs and SLOs?
Service levels are used to measure the performance of a service from the end user (or client application) point of view. For instance, a service level can represent whether a video loaded quickly enough, or whether a directions service returned at least one possible route between two points.
Service level indicators are accurate quantitative measures of the user experience as described by a service level. They represent a proportion of successful outputs, and therefore they’re expressed as a percentage (%). For example, an SLI can measure the proportion of requests that were faster than some threshold, or the proportion of records coming into a pipeline that resulted in the correct value coming out.
And while users understand that a video might take a few additional seconds to load, or that an application might return an error from time to time, this shouldn’t happen often if you don’t want to lose their trust. Therefore, once you’ve defined SLIs for the performance aspects that are most relevant for the end users of your services, you need to set SLOs to track that the service is meeting their expectations. Service level objectives are defined as a target value that an SLI must meet over a period of time. For example, videos must start playing in less than 2 seconds 99% of the time over a week period.

See the Service level management use case implementation guide to learn more about identifying service boundaries and deploying the instrumentation that your service levels will be based on.
Service levels and APM SLA reports
New Relic has provided automatic service level agreement (SLA) reports for APM services for a long time. The Apdex-based reports, which you can get on your email inbox on Mondays, are automatically generated for services that produce web transactions, and are useful to see trends over time.
On top of the SLAs, our service levels capability is better aligned with modern service level best practices, such as those promoted by the Google SRE Handbook, and provides new, improved functionality:
- SLIs can be defined on any NRDB event that is reported to New Relic, not just transactions. Therefore you can also base SLIs on your own custom events.
- You can decide which service boundaries and which metrics are relevant for your service levels, and you can set your own objectives.
- You can view SLO results across your accounts, and within your workloads.
What's next?
You can find service levels in several places in our UI:
- At one.newrelic.com
- At the previews of those entities that have an SLI defined.
- In APM services, Browser applications, or Synthetic monitors at the reports section.
- Within a workload, at the service levels tab.
Carry on and read our docs on how to create and consume SLIs and SLOs. You can also check out how to configure service levels via the NerdGraph API.
For tips and best practices on setting up and using SLM, see our observability maturity guide on optimizing SLM.