In your kubernetes system, each pod contains services and applications that provide the actual functionality that your kubernetes system supports. The system could support computation, a web app, or anything inbetween.
Your system might be healthy as a whole, but individual applications and services might fail or throw errors. The following steps guide you through a general strategy to monitor and triage your applications and services:
Navigate to the APM Kubernetes dashboard
Go to one.newrelic.com > All capabilities > APM & Services > select your application > Kubernetes.
Triage your application
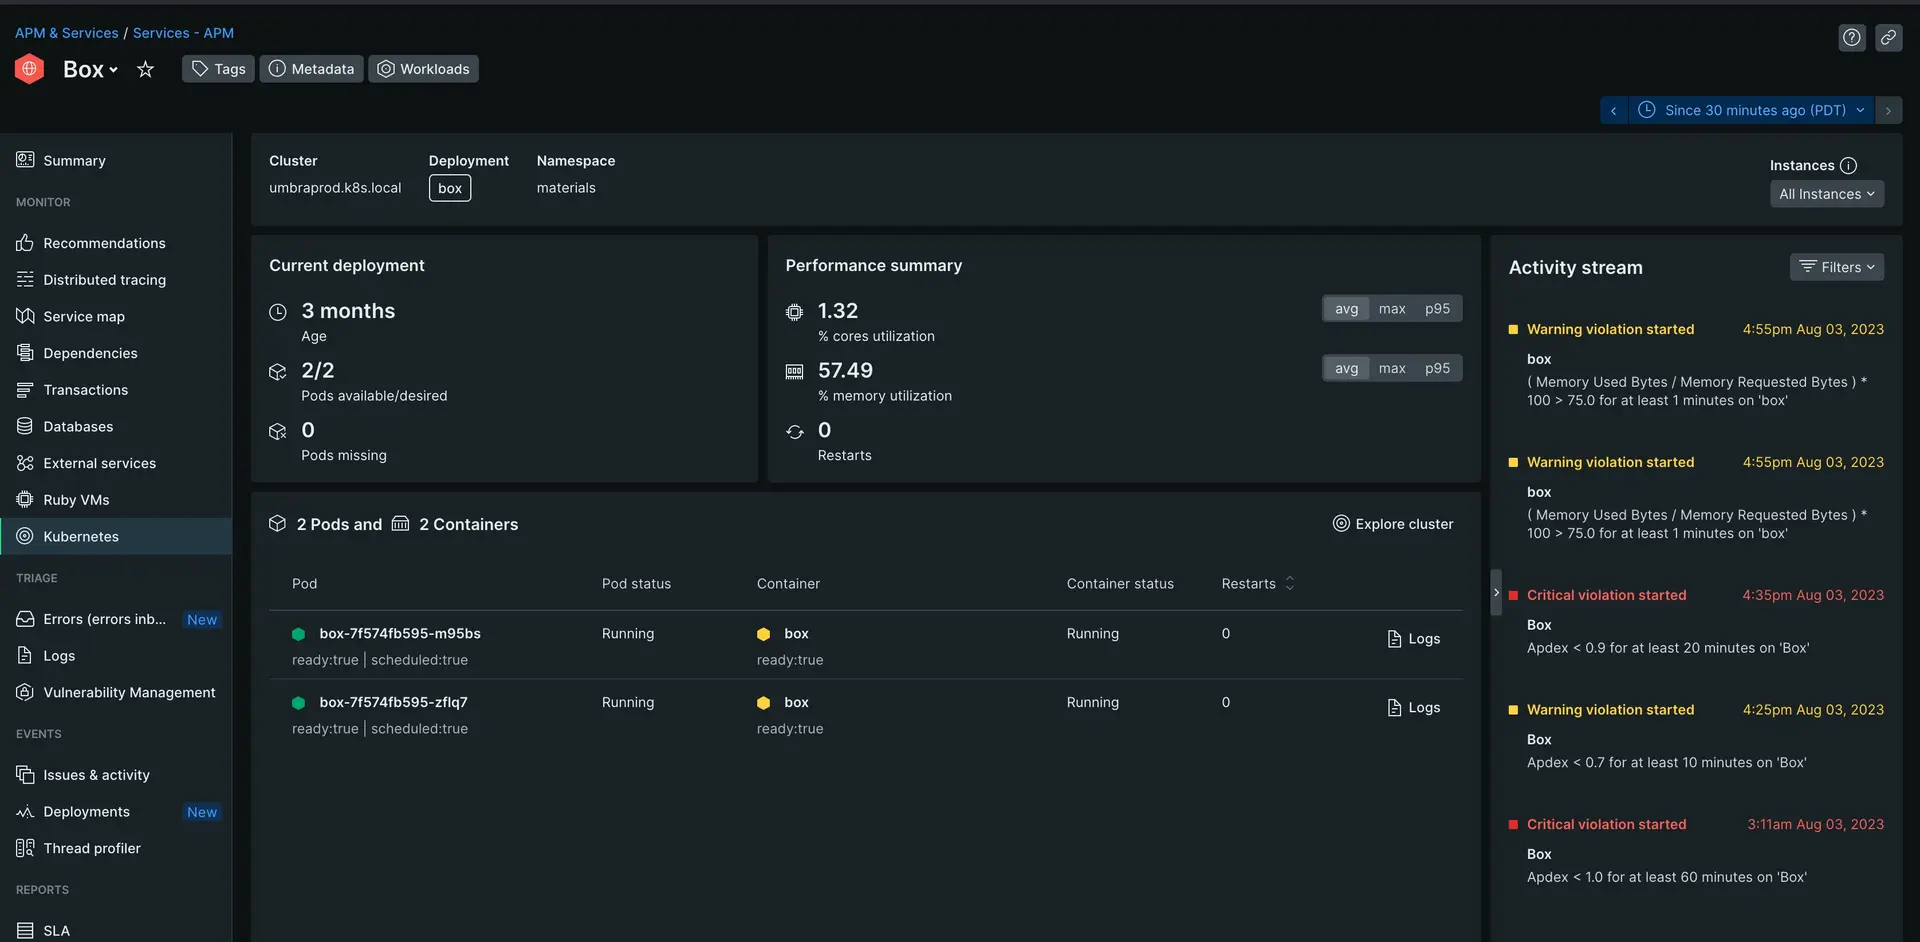
This page shows you a general overview of all the instances of that application within your Kubernetes cluster. There are various useful charts and graphs here, but take a close look at the activity stream on the far right. This will highlight any important performance events of those applications. Increase the time range as necessary to gather a full view of the performance history.
Only you can decide what's acceptable, but multiple events a day indicates you could improve performance. For example, in the image above there are multiple Apdex warnings within just a few hours. Apdex warnings indicate a degraded user experience.

Identify the cause of performance issues
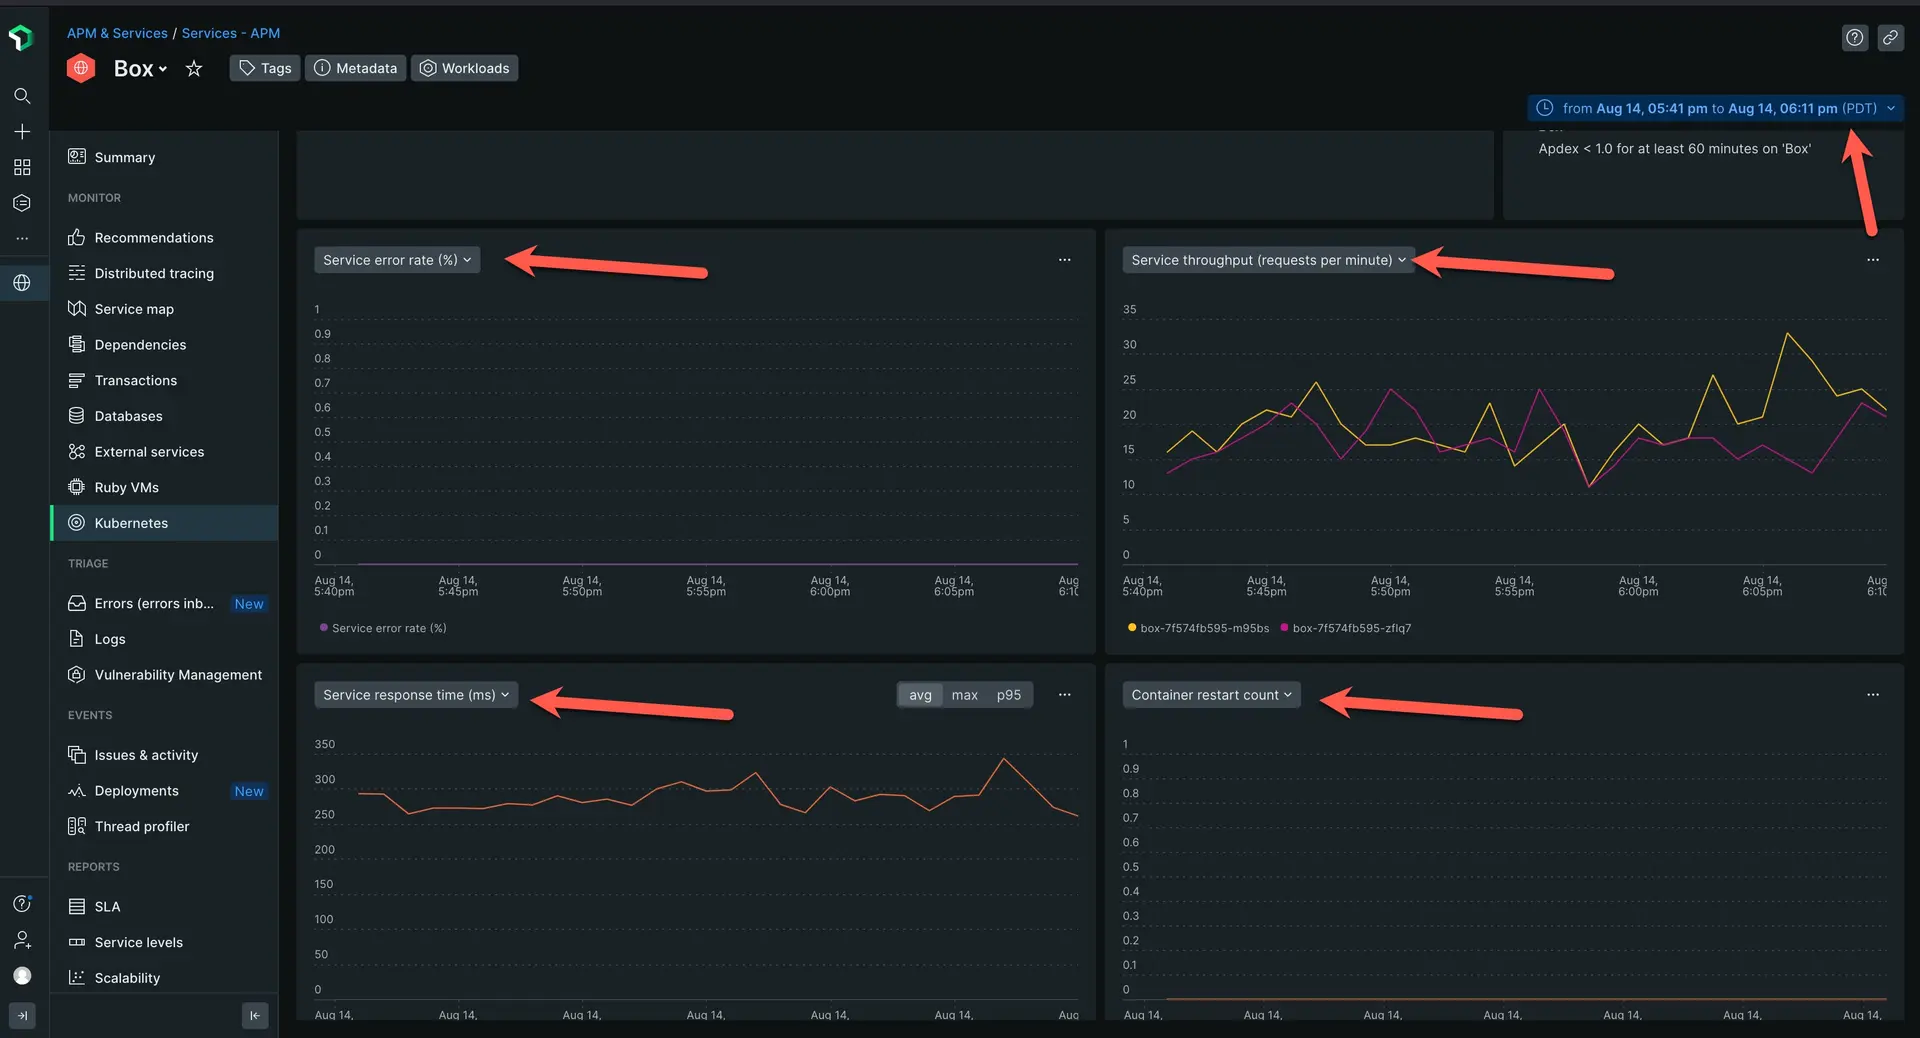
Scroll down until you see four graphs. On the top left of each graph, select the dropdown and set the graphs to the following:
Service error rate
Service throughput
Service response time
Container restart count

The first three graphs will show you the health of your applications. The restart count graph helps you correlate if your performance has any affect on your general pod health.
In the screenshot above we can note a few things:
The error rate stays at zero, which means errors are not affecting performance
The service throughput spikes extremely often
The service response time regularly fluctutes close to 70ms
The container restart graph stays at zero, which means the performance of my applications is not causing critical failures in my cluster
In this case, you can identify throughput and response time as the key indicators of your degraded performance. There are many ways to solve these from optimizing the application itself or just throwing more CPU power at the containers hosting the application.
What's next?
Now that you've learned how to use New Relic to monitor Kubernetes, you can explore our other tutorials:
- Is your app running slow? Learn how to triage and diagnose latency in your app with our My app is slow tutorial.
- If you have a peak demand day coming up, learn how New Relic can help you with capacity planning.
- Do you want to create high quality alerts? Our alerts tutorial can help you set up an alerting system.