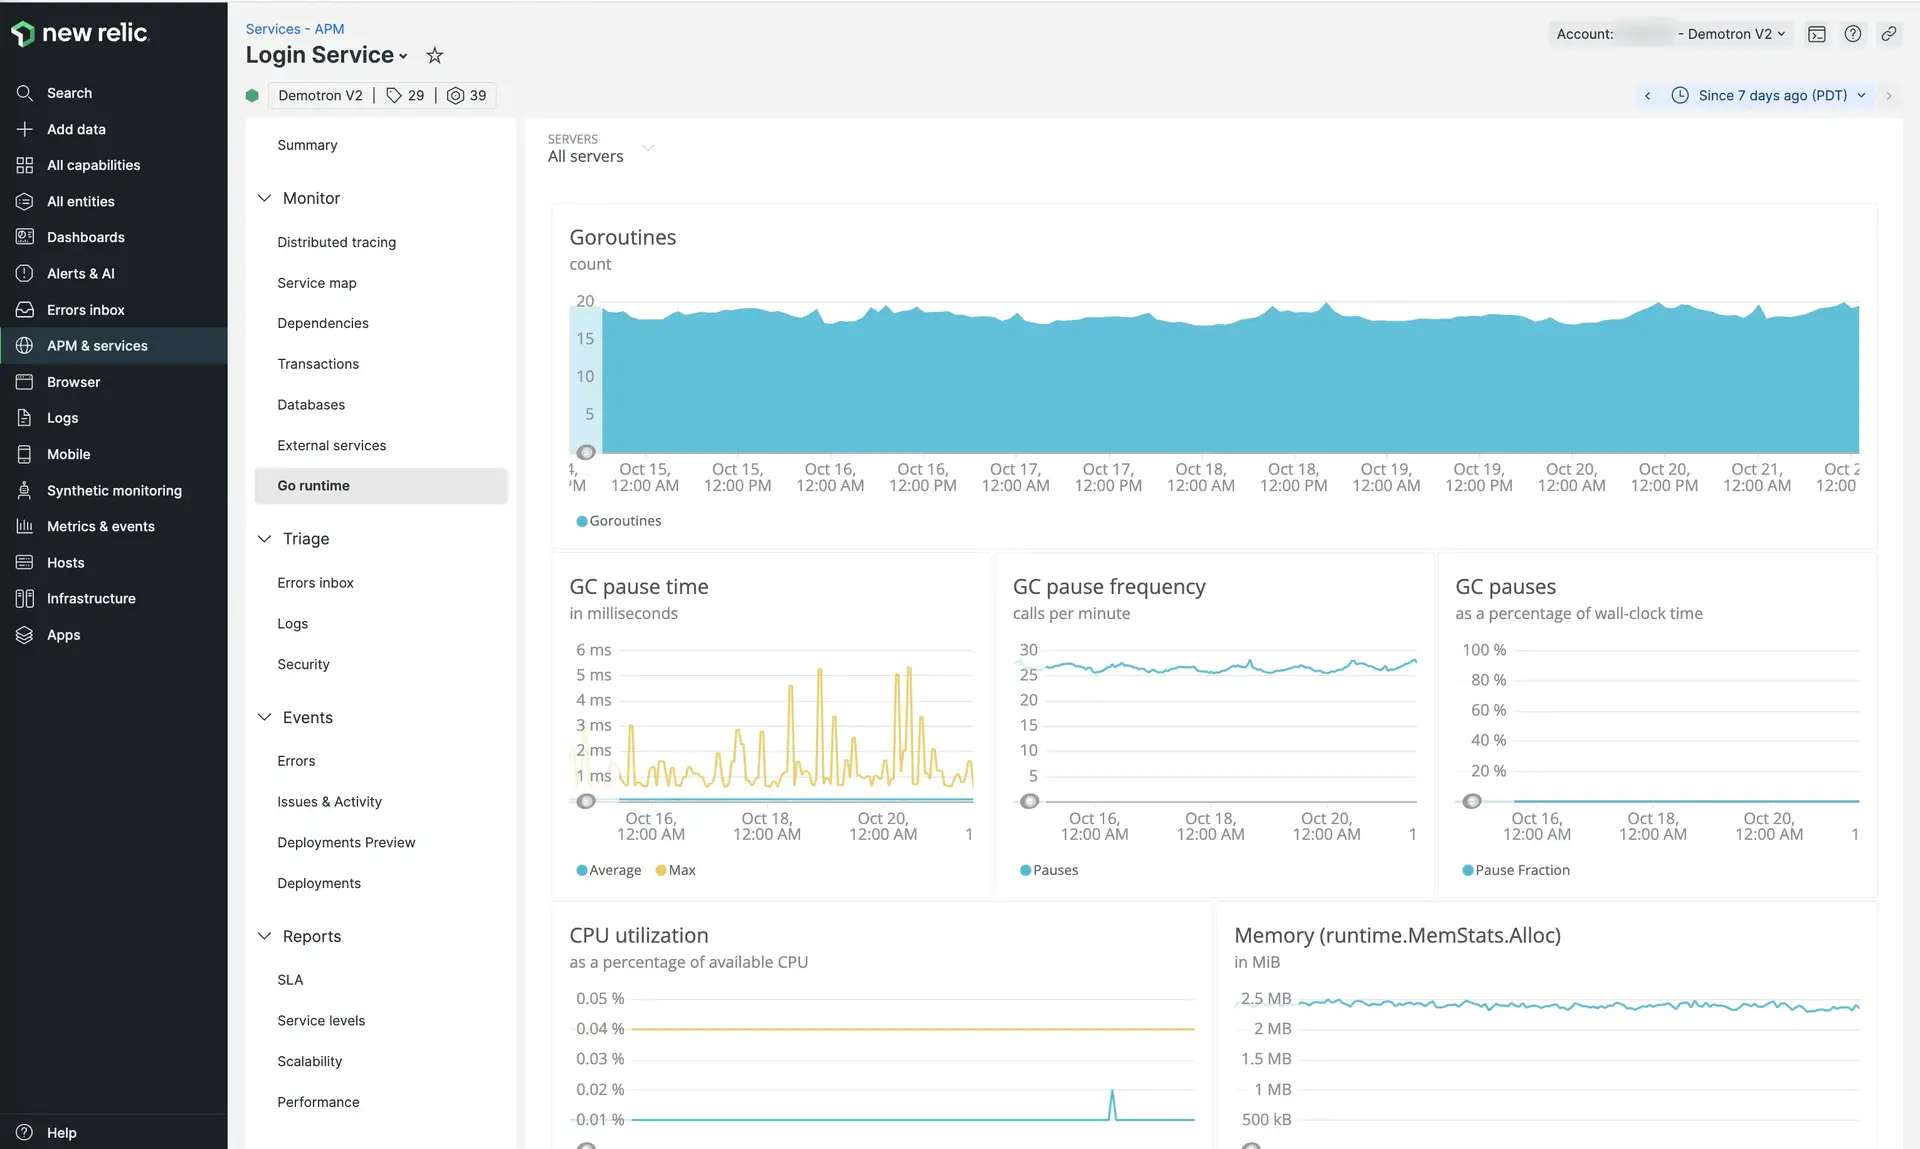
The APM user interface provides a variety of data about your app, including special features for the Go agent for APM. In addition, the Go runtime page provides important runtime data useful for troubleshooting performance issues.
View and filter Go runtime data
To view the Go runtime page, go to one.newrelic.com > All capabilities > APM & services > (select an app) > Go runtime.

Go runtime charts
This table describes the Go runtime page chart data.
Chart name | Description |
|---|---|
Goroutines | A count of the average number of goroutines running during a given time slice. |
GC pause time | Milliseconds spent in stop-the-world garbage collection. |
GC pause frequency | Calls per minute of stop-the-world garbage collection. |
GC pauses | The percentage of wall-clock time spent in stop-the-world garbage collection. |
CPU utilization | CPU utilization as a percentage of available CPU. |
Memory | Average memory used, in mebibytes, during a given time slice. |