Our NVIDIA GPU integration lets you monitor the status of your GPUs. This integration uses our infrastructure agent with the Flex integration, which lets us access NVIDIA's SMI utility.

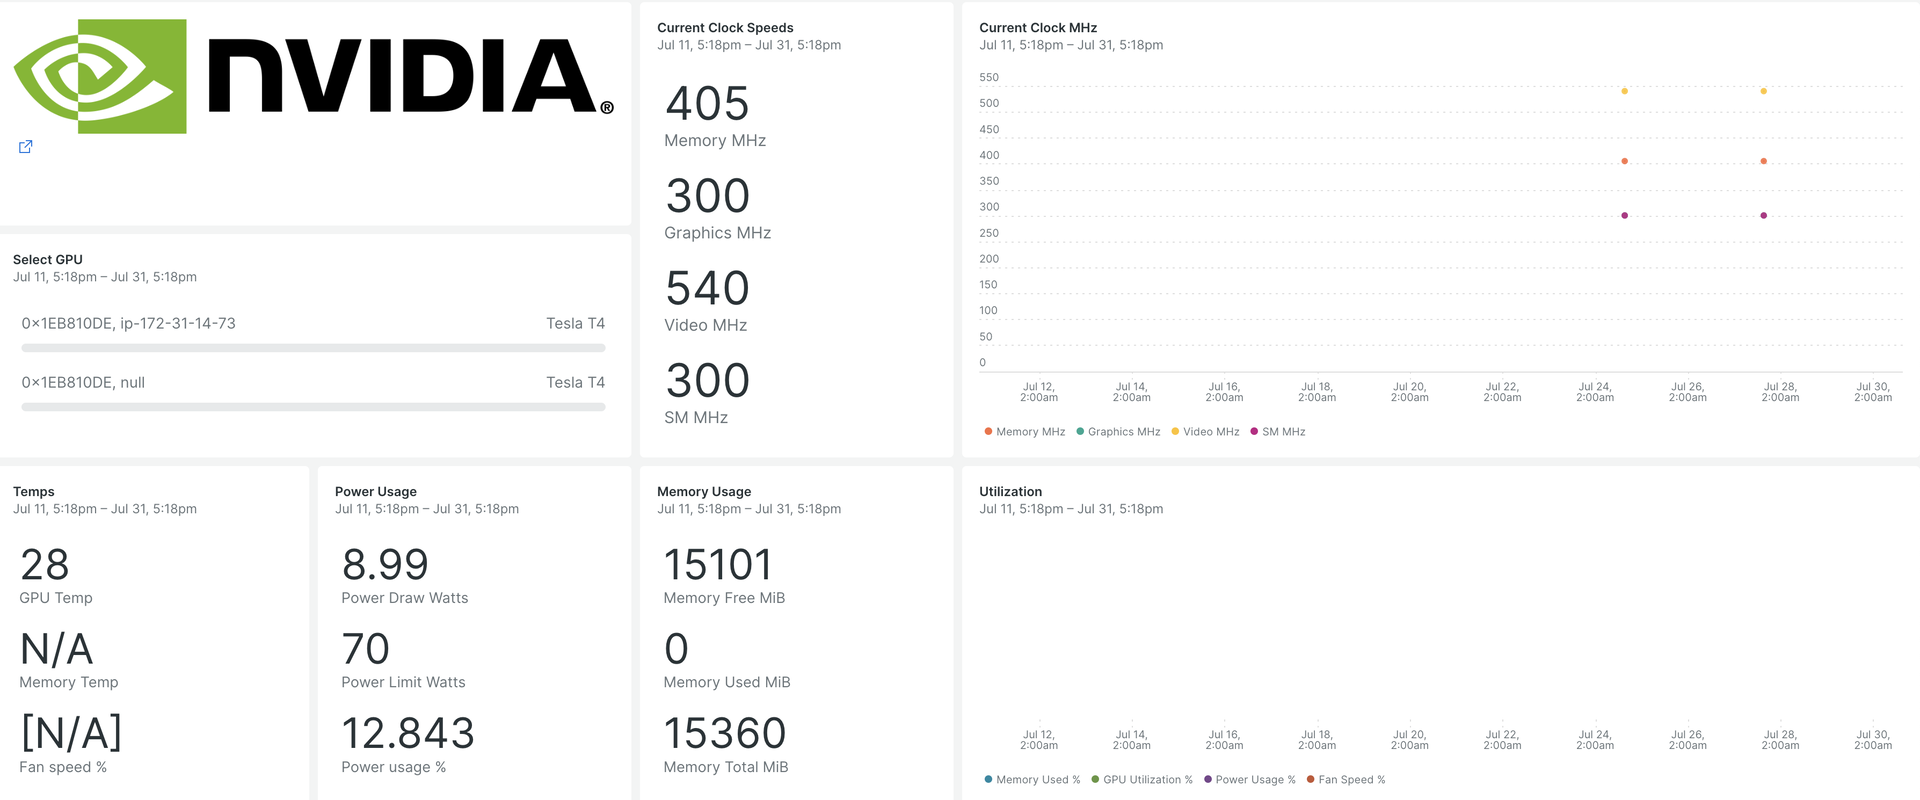
After you set up our NVIDIA GPU integration, we give you a dashboard for your GPU metrics.
When you install, you'll get a pre-built dashboard containing crucial GPU metrics:
- GPU utilization
- ECC error counts
- Active compute processes
- Clock and performance states
- Temperature and fan speed
- Dynamic and static information about each supported device
Install the infrastructure agent
To capture data with New Relic, install our infrastructure agent. Our infrastructure agent collects and ingests data so you can keep track of your GPUs performance.
You can install the infrastructure agent two different ways:
- Our guided install is a CLI tool that inspects your system and installs the infrastructure agent alongside the application monitoring agent that best works for your system. To learn more about how our guided install works, check out our Guided install overview.
- If you'd rather install our infrastructure agent manually, you can follow a tutorial for manual installation for Linux, Windows.
Configure Flex integration for NVIDIA GPUs
Flex comes bundled with the New Relic infrastructure agent and it can be integrated with the NVIDIA SMI, a command line utility to monitor NVIDIA GPU devices.
Importante
nvidia-smi ships pre-installed with NVIDIA GPU display drivers on Linux and Windows Server.
Follow these steps to configure Flex:
Create a file named
nvidia-smi-gpu-monitoring.ymlin this path:bash$sudo touch /etc/newrelic-infra/integrations.d/nvidia-smi-gpu-monitoring.ymlYou may also download from the git repository.
Update the
nvidia-smi-gpu-monitoring.ymlfile with the integration config:---integrations:- name: nri-flex# interval: 30sconfig:name: NvidiaSMIvariable_store:metrics:"name,driver_version,count,serial,pci.bus_id,pci.domain,pci.bus,\pci.device_id,pci.sub_device_id,pcie.link.gen.current,pcie.link.gen.max,\pcie.link.width.current,pcie.link.width.max,index,display_mode,display_active,\persistence_mode,accounting.mode,accounting.buffer_size,driver_model.current,\driver_model.pending,vbios_version,inforom.img,inforom.oem,inforom.ecc,inforom.pwr,\gom.current,gom.pending,fan.speed,pstate,clocks_throttle_reasons.supported,\clocks_throttle_reasons.gpu_idle,clocks_throttle_reasons.applications_clocks_setting,\clocks_throttle_reasons.sw_power_cap,clocks_throttle_reasons.hw_slowdown,clocks_throttle_reasons.hw_thermal_slowdown,\clocks_throttle_reasons.hw_power_brake_slowdown,clocks_throttle_reasons.sw_thermal_slowdown,\clocks_throttle_reasons.sync_boost,memory.total,memory.used,memory.free,compute_mode,\utilization.gpu,utilization.memory,encoder.stats.sessionCount,encoder.stats.averageFps,\encoder.stats.averageLatency,ecc.mode.current,ecc.mode.pending,ecc.errors.corrected.volatile.device_memory,\ecc.errors.corrected.volatile.dram,ecc.errors.corrected.volatile.register_file,ecc.errors.corrected.volatile.l1_cache,\ecc.errors.corrected.volatile.l2_cache,ecc.errors.corrected.volatile.texture_memory,ecc.errors.corrected.volatile.cbu,\ecc.errors.corrected.volatile.sram,ecc.errors.corrected.volatile.total,ecc.errors.corrected.aggregate.device_memory,\ecc.errors.corrected.aggregate.dram,ecc.errors.corrected.aggregate.register_file,ecc.errors.corrected.aggregate.l1_cache,\ecc.errors.corrected.aggregate.l2_cache,ecc.errors.corrected.aggregate.texture_memory,ecc.errors.corrected.aggregate.cbu,\ecc.errors.corrected.aggregate.sram,ecc.errors.corrected.aggregate.total,ecc.errors.uncorrected.volatile.device_memory,\ecc.errors.uncorrected.volatile.dram,ecc.errors.uncorrected.volatile.register_file,ecc.errors.uncorrected.volatile.l1_cache,\ecc.errors.uncorrected.volatile.l2_cache,ecc.errors.uncorrected.volatile.texture_memory,ecc.errors.uncorrected.volatile.cbu,\ecc.errors.uncorrected.volatile.sram,ecc.errors.uncorrected.volatile.total,ecc.errors.uncorrected.aggregate.device_memory,\ecc.errors.uncorrected.aggregate.dram,ecc.errors.uncorrected.aggregate.register_file,ecc.errors.uncorrected.aggregate.l1_cache,\ecc.errors.uncorrected.aggregate.l2_cache,ecc.errors.uncorrected.aggregate.texture_memory,ecc.errors.uncorrected.aggregate.cbu,\ecc.errors.uncorrected.aggregate.sram,ecc.errors.uncorrected.aggregate.total,retired_pages.single_bit_ecc.count,\retired_pages.double_bit.count,retired_pages.pending,temperature.gpu,temperature.memory,power.management,power.draw,\power.limit,enforced.power.limit,power.default_limit,power.min_limit,power.max_limit,clocks.current.graphics,clocks.current.sm,\clocks.current.memory,clocks.current.video,clocks.applications.graphics,clocks.applications.memory,\clocks.default_applications.graphics,clocks.default_applications.memory,clocks.max.graphics,clocks.max.sm,clocks.max.memory,\mig.mode.current,mig.mode.pending"apis:- name: NvidiaGpucommands:- run: nvidia-smi --query-gpu=${var:metrics} --format=csv # update this if you have an alternate pathoutput: csvrename_keys:" ": """\\[MiB\\]": ".MiB""\\[%\\]": ".percent""\\[W\\]": ".watts""\\[MHz\\]": ".MHz"value_parser:"clocks|power|fan|memory|temp|util|ecc|stats|gom|mig|count|pcie": '\d*\.?\d+''.': '\[N\/A\]|N\/A|Not Active|Disabled|Enabled|Default'
Confirm GPU metrics are being ingested
The Flex configuration will be automatically detected and executed by the infrastructure agent, there's no need to restart the agent. You can confirm metrics are being ingested by running this NRQL query:
SELECT * FROM NvidiaGpuSampleMonitor your application
You can use our pre-built dashboard template to monitor your GPU metrics. Follow these steps:
Go to one.newrelic.com and click on Dashboards.
Click on the Import dashboard tab.
Copy the file content (
.json) from the NVIDIA GPU dashboard.Select the target account where the dashboard needs to be imported.
Click on Import dashboard to confirm the action.
Your
NVIDIA GPU Monitoringdashboard is considered a custom dashboard and can be found in the Dashboards UI. For docs on using and editing dashboards, see our dashboard docs.Here is a NRQL query to view all the telemetry available:
SELECT * FROM NvidiaGpuSample
What's next?
You can adapt the Flex configuration to include or exclude information available from the NVIDIA SMI utility.
To learn more about building NRQL queries and generating dashboards, check out these docs:
- Introduction to the query builder to create basic and advanced queries.
- Introduction to dashboards to customize your dashboard and carry out different actions.
- Manage your dashboard to adjust your display mode, or to add more content to your dashboard.