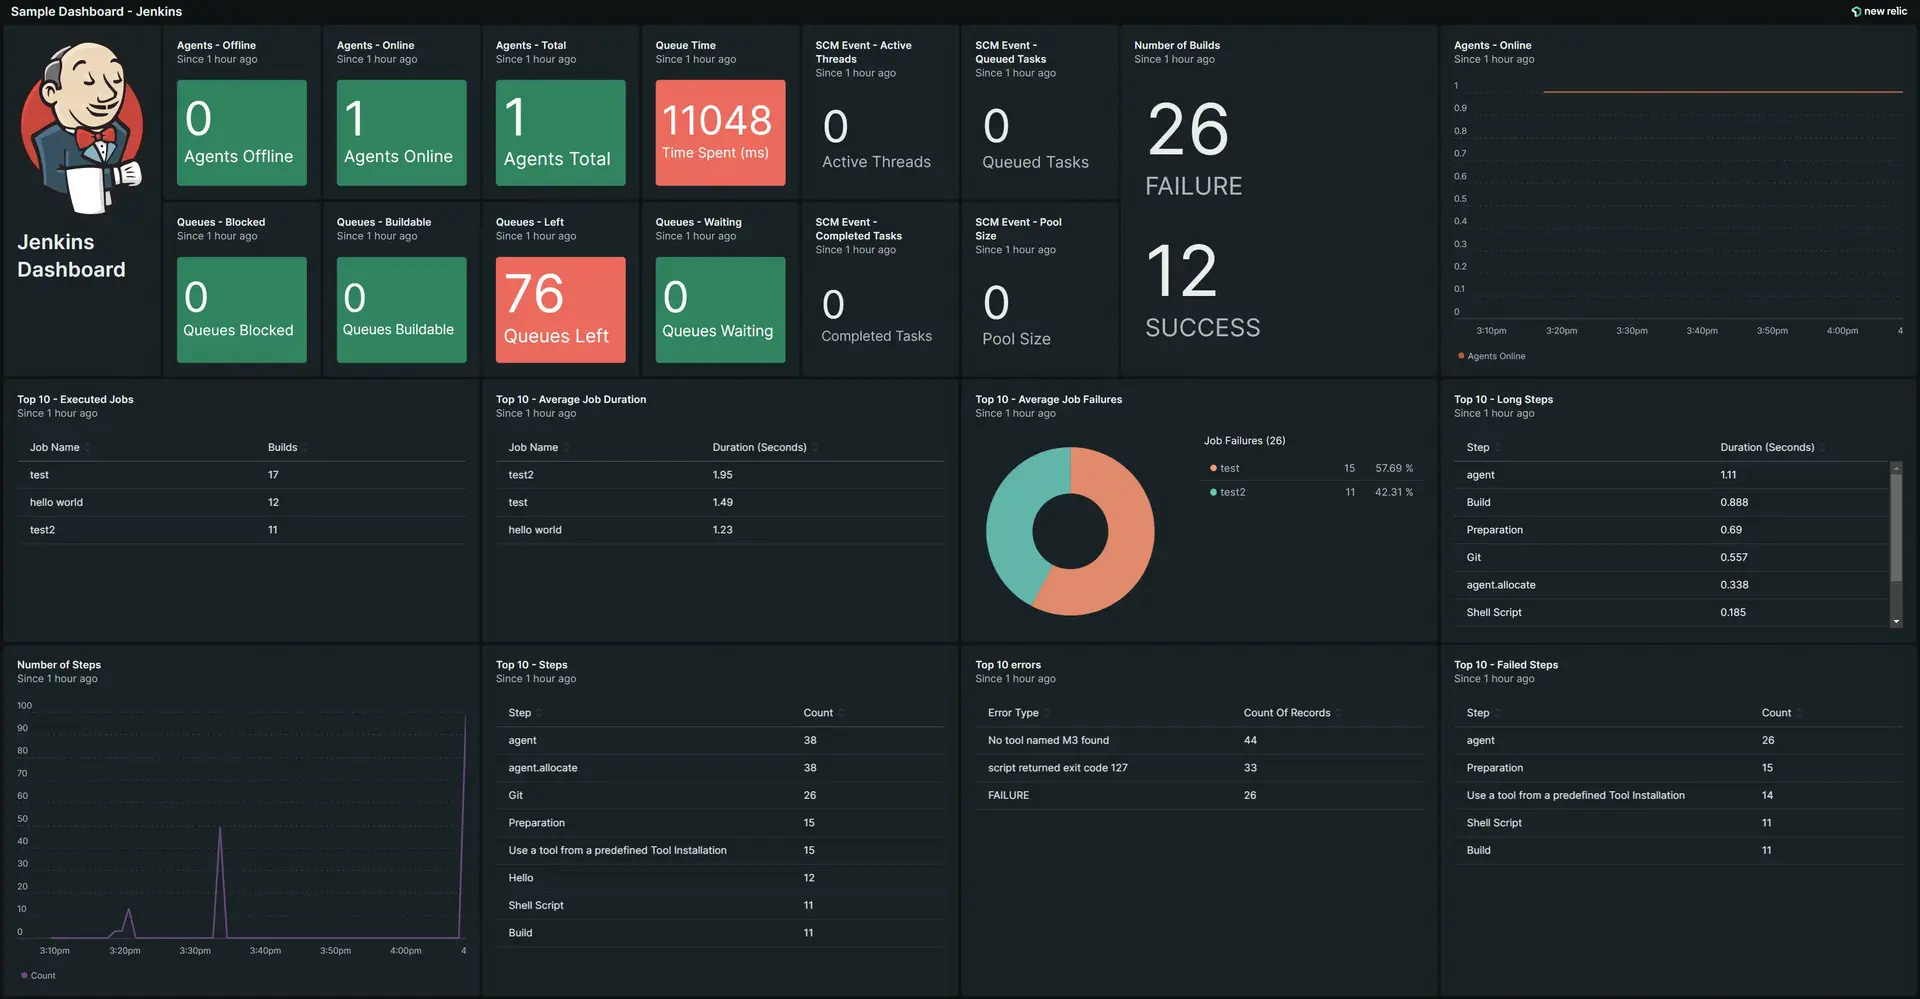
Monitor Jenkins with the OpenTelemetry plugin by visualizing jobs and pipeline executions as distributed traces. You can also install the quickstart to get a pre-built dashboard to monitor your Jenkins pipeline.
Prerequisites
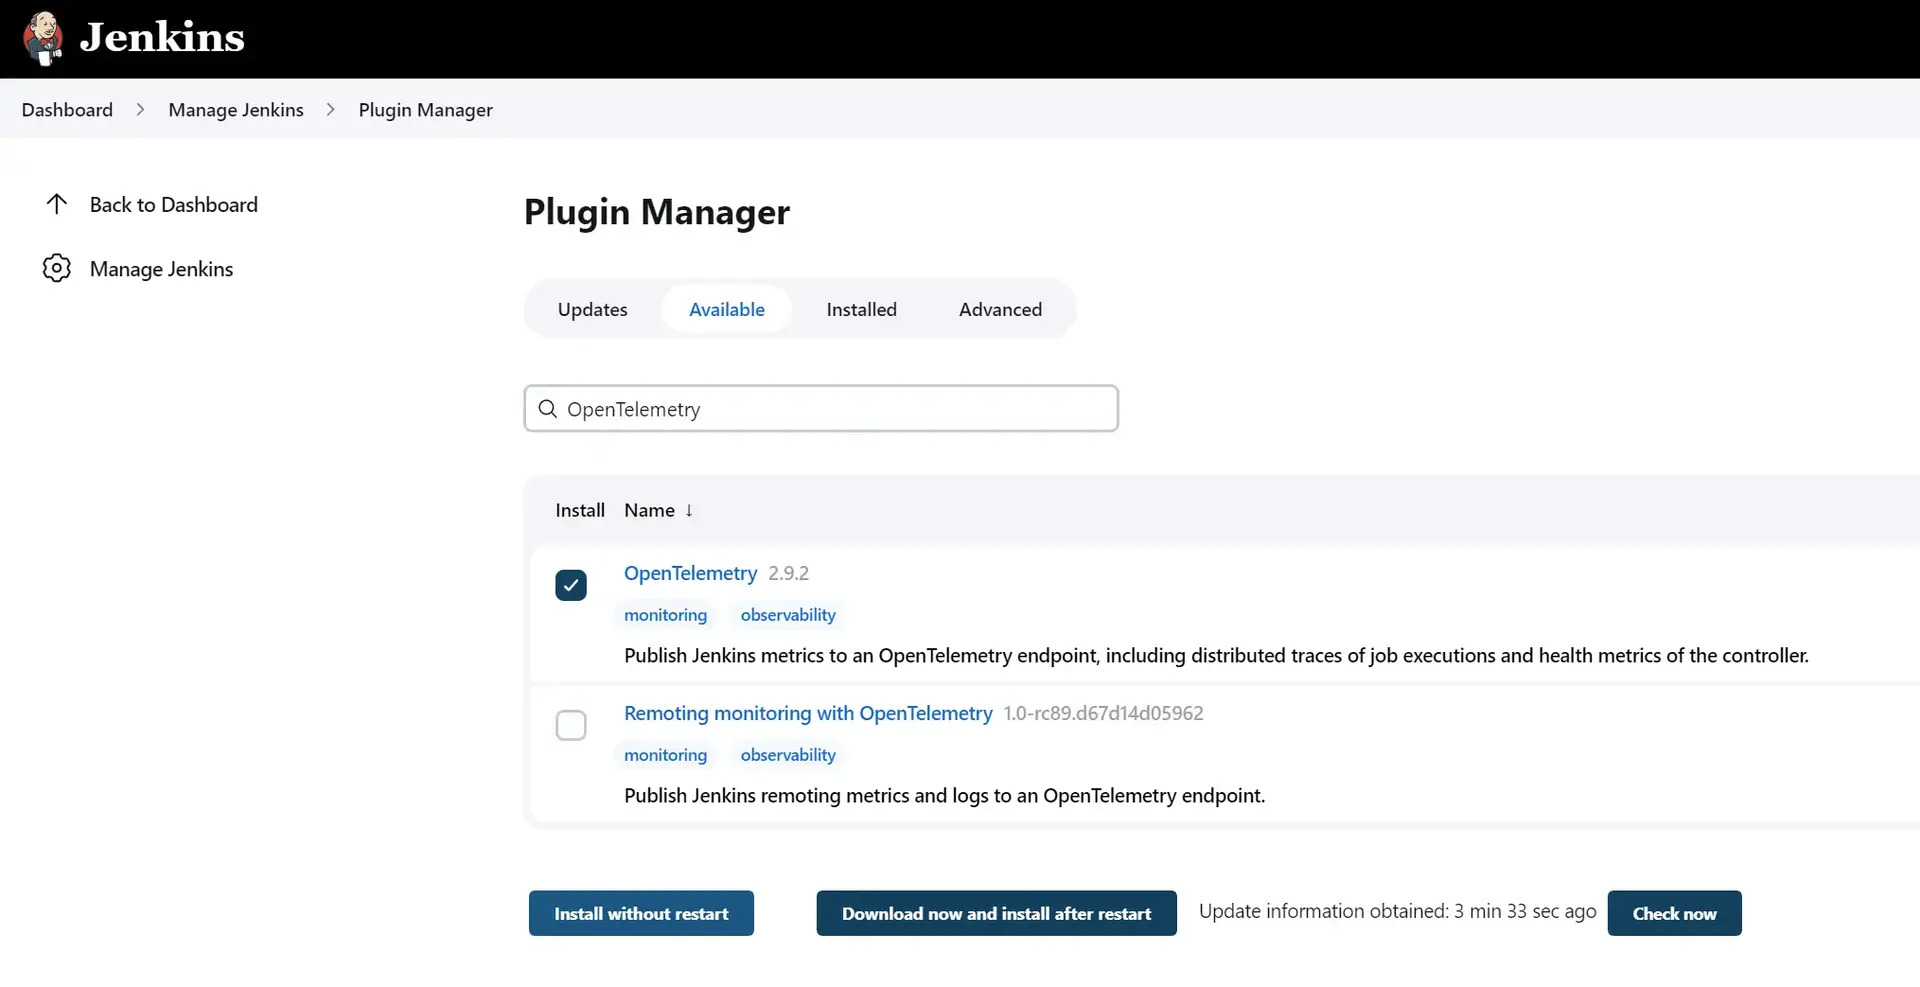
You need to first install the OpenTelemetry plugin from Jenkins:
- Log into Jenkins.
- From the Dashboard, click on Manage Jenkins.
- Under System Configuration, click Plugins.
- Click the Available plugins tab, then search for OpenTelemetry.
- Select the OpenTelemetry checkbox, and Install without restart.
- Once the installation is complete, click Manage Jenkins.
- Under System Configuration, click System.
- Scroll down and check for a section called OpenTelemetry. If you can't see it, restart Jenkins.
Configuration
You need a New Relic OTLP endpoint and an to configure the Jenkins OpenTelemetry plugin to send data to New Relic.
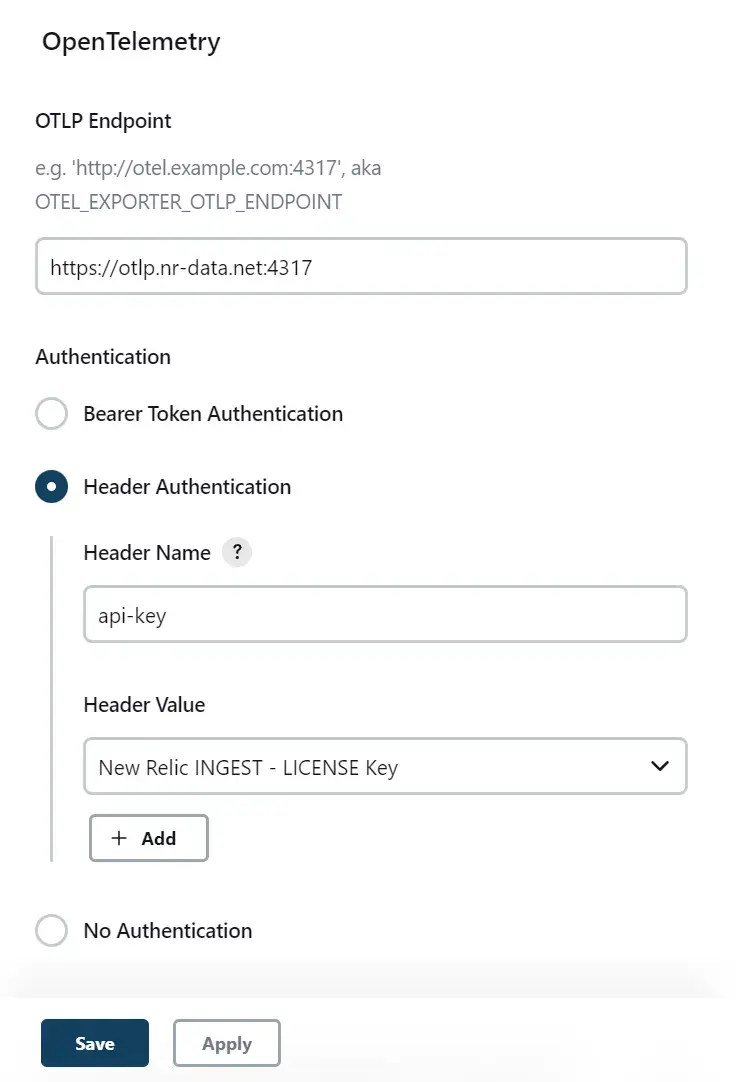
- Enter an OTLP endpoint. For example,
https://otlp.nr-data.net:4317. - For authentication, select Header Authentication: a. In the Header Name field, enter api-key. b. In the Header Value field, enter a secret text containing your New Relic ingest license key.
- Save the changes.
If you don't have a secret text created with your New Relic license key, click the + Add button and select Jenkins Credentials Provider, to create one. You can keep the default values except for kind and secret and the description is optional.
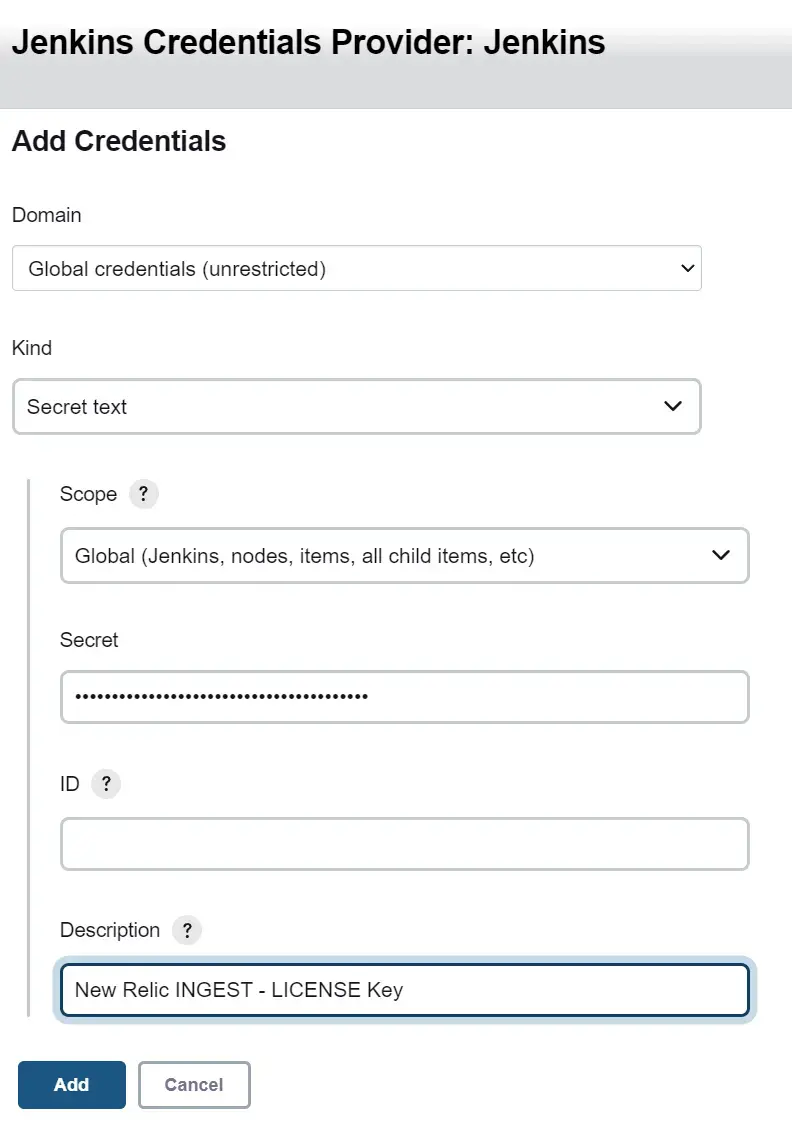
- From the Kind dropdown, select Secret text.
- In the secret field, enter your New Relic ingest license key.
- Optionally, add a description to note what the secret text is for.
Validation
Run a job or create a new pipeline to see Jenkins data in New Relic. Here's how to build a pipeline:
- Log into Jenkins and click New Item.
- Enter an item name, click Pipeline, and then OK.
- Scroll down to the very bottom to the Pipeline section.
- Use the Pipeline script, and select an option from the try sample Pipeline... dropdown.
- Click Save.
- In the newly created pipeline, click Build Now.
- Got to one.newrelic.com > All capabilities > APM & services > Services - OpenTelemetry > jenkins.
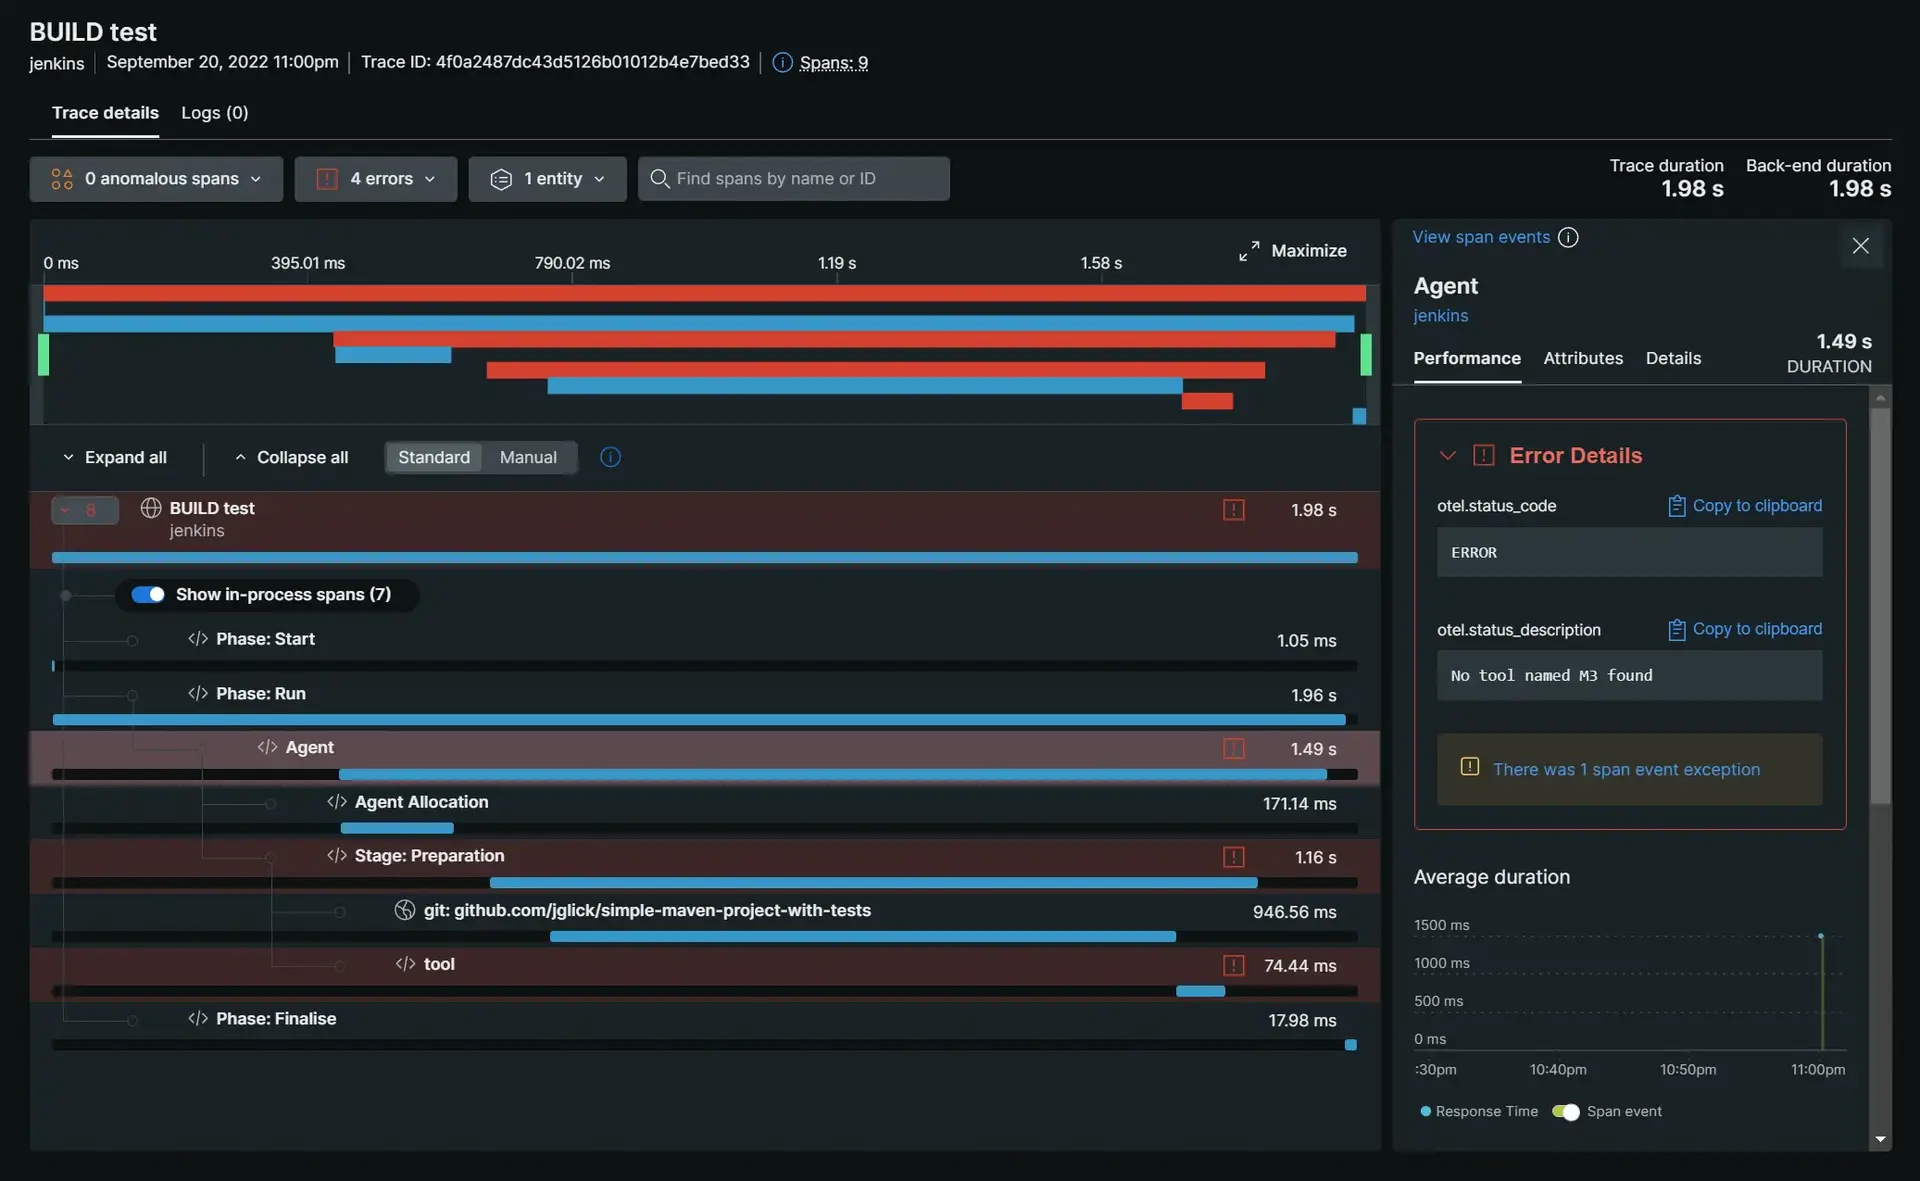
- Click Distributed tracing to visualize jobs and pipeline executions.
- Click Logs to see your Jenkins console logs. If there are no logs, check to make sure the environment variable
OTEL_LOGS_EXPORTER="otlp"is set.
Install the Jenkins quickstart dashboard
After you've sent your Jenkins pipeline data to New Relic, you can also easily monitor your jobs and pipeline executions with the prebuilt dashboard from New Relic Instant Observability. Get started in minutes with a pre-built dashboard to see key metrics in a consolidated view:
- Go to the Jenkins quickstart in New Relic Instant Observability, and click + Install now.
- Select an account and click Begin installation.
- If you've already completed the validation, select done to move onto the next step.
- The quickstart deploys the resources to your account. Click see your data to get to the dashboard.
Importante
If your service name (OTEL_SERVICE_NAME) is configured as something other thanjenkins, update theWHEREconditions ofentity.nameon the prebuilt dashboard to use the configured service name.

Importante
The Jenkins OpenTelemetry plugin is not maintained by New Relic, so if you have any issues with the instrumentation, create a new issue in the plugin's GitHub repo.
Resource attributes and tags
You can add resource attributes to the Jenkins plugin configuration. This allows you to include attributes for all the plugin generated log, metric, and trace data. Resource attributes that have names starting with tags. will also add entity tags to your Jenkins entity.
You can define attributes in two ways: