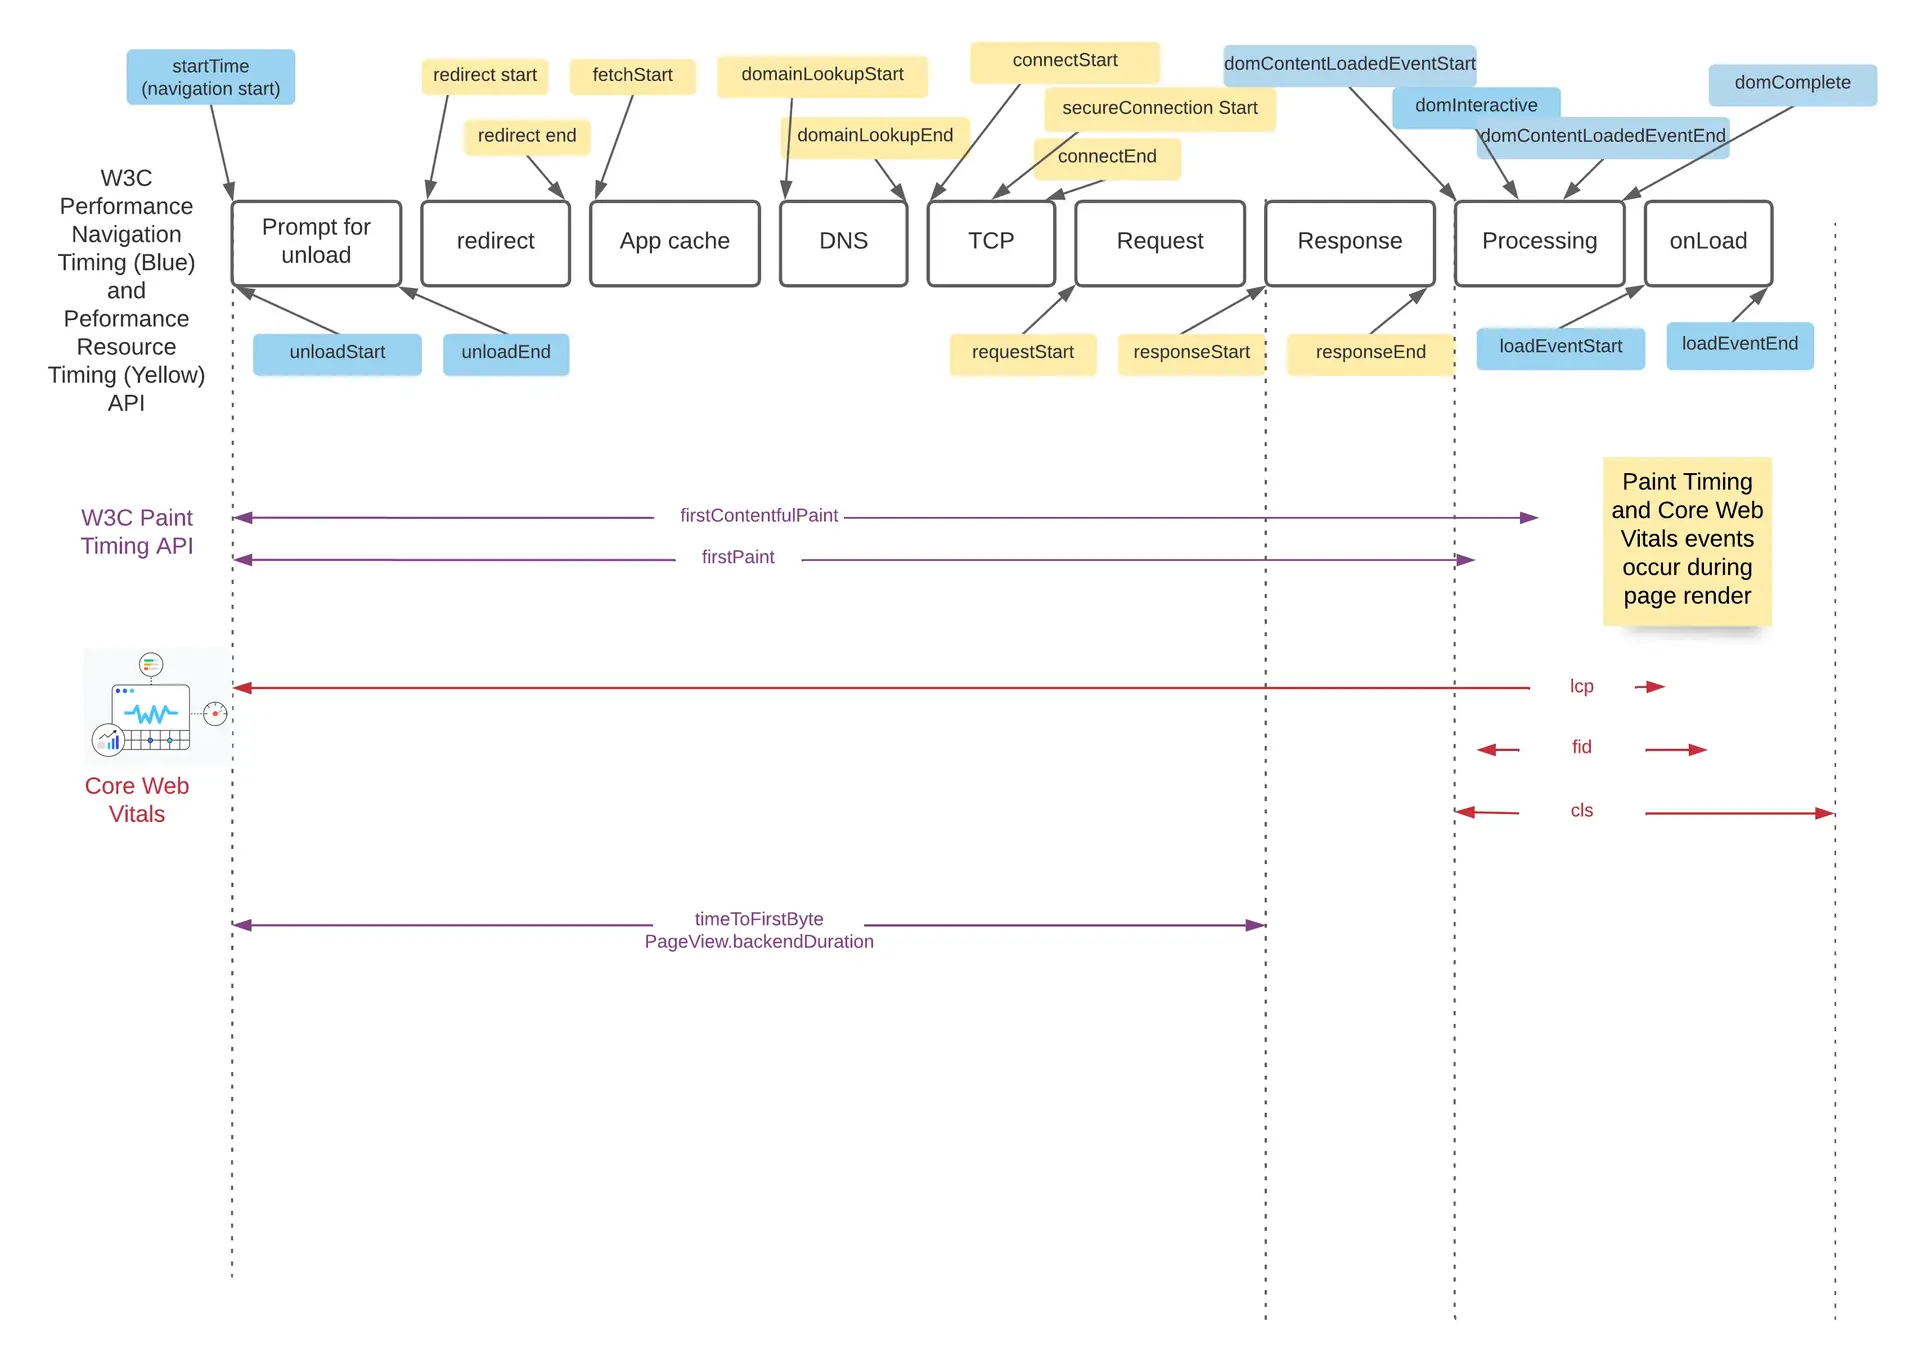
Page load performance measurement continues to evolve. In order to improve the overall performance and user experience, it helps to understand the different metrics and how they relate to each other.

Before following the guidance below, narrow your scope to specific pages that you are trying to improve. For maximum impact, focus on pages that are frequently accessed but have a lower than accepted score for the 75th percentile of users.
Page load KPI
How to improve time to first byte (TTFB):
Time to first byte measures the time from navigation start (a user clicking a link) to the browser receiving the first byte of the response from the server. If users in the 75th percentile are experiencing a TTFB of greater than 0.5s for one or more of your pages, you can break timings down further by querying the following attributes in PageView:
backendDurationconnectionSetupDurationdnsLookupDurationnetworkDuration
Often, slowness prior to rendering is caused by slowness in the backend, either from third-party APIs or backend applications.
Synthetic monitoring for third party APIs helps operations and development teams understand when the root cause is outside of their control. Even if you cannot control the code, you can influence the outcome by sharing synthetics results with the third party to help them understand what your customers are experiencing.
If the backend applications are owned by you or your team, you can use agents, Pixie, or OpenTelemetry to understand and manage performance. To make cross team communication easier, we recommend implementing Service Level Management boundaries.
Cumulative layout shift (CLS)
Cumulative layout shift is a score that indicates how much content shifts once it has already loaded. General tips and tricks for improving CLS:
- Specify dimensions for stylesheets and let the browser's default CSS control the aspect ratio.
- Statically reserve space for ad slots.
- Avoid ads near the top of the viewport.
- Avoid inserting new content above existing content.
- Precompute sufficient space for embeds.
Additional resources:
- Google's approach to CLS optimization.
- Lighthouse is a tool by Google that runs a synthetic test against a specific page and provides a list of recommendations that include how to optimize CLS.
Largest contentful paint (LCP)
Largest contentful paint measures the difference between the start of page render until the time to paint the largest content element. Common causes for a slow LCP, according to web.dev:
- Slow server response times
- Render-blocking JavaScript and CSS
- Slow resource load times
- Client-side rendering
Use Browser session trace information to understand which of the common causes above factor into the particular page you are trying to optimize.
Approaches to improve LCP:
- Make use of CDNs and pay attention to caching and edge server performance.
- Establish third-party connections early.
- Delay non-critical Javascript and CSS.
Additional resources:
- Google's approach to LCP optimization.
- Lighthouse is a tool by Google that runs a synthetic test against a specific page and provides a list of recommendations that include how to optimize CLS.
Interaction to next paint (INP)
Interaction to next paint (INP) calculates when a user interacts with a page via clicks, taps, and keyboard interactions with a page throughout its lifespan. It's a field metric that varies based on real user behavior (results vary based on user impatience and action timing) but can be optimized by reducing total blocking time (TBT).
To do this, you need to:
- Break up long blocking tasks.
- Optimize bloated JavaScript.
- Look at moving logic server side and/or use web workers to run threads in the background.
Use Browser session trace information to understand where your blocking intervals are occurring and for how long they last.
Additional resources:
- Google's approach to INP optimization.
- Lighthouse is a tool by Google that runs a synthetic test against a specific page and provides a list of recommendations that include how to optimize INP.