Problem
For our , , and features, there can be cases when an account or application is sending many individual metric timeslice data points that could be better managed by grouping them together. We use the term metric grouping issue or MGI to describe this situation. When this occurs, the agent is sending unnecessarily large amounts of data to New Relic, which reduces the effectiveness of New Relic charts, tables, and reports.
Metric grouping issues occur most commonly with web transactions, especially if the name is based on URLs. They can also happen with other metrics reported by your application. For example:
- If your application is crawling the Internet and each external call goes to a different domain
- If your software dynamically generates temporary database tables every time you receive a request
- If you are using custom instrumentation that includes UUIDs, article names, or similar unique components
Any situation where a potentially infinite list of metrics can be created, rather than metrics being grouped effectively (as with controllers, permanent database tables, or specific external services) can become a metric grouping issue.
Solution
By understanding what metric grouping is and how issues can arise, you can better understand how New Relic works with your application to group metrics effectively and help prevent metric grouping issues from occurring.

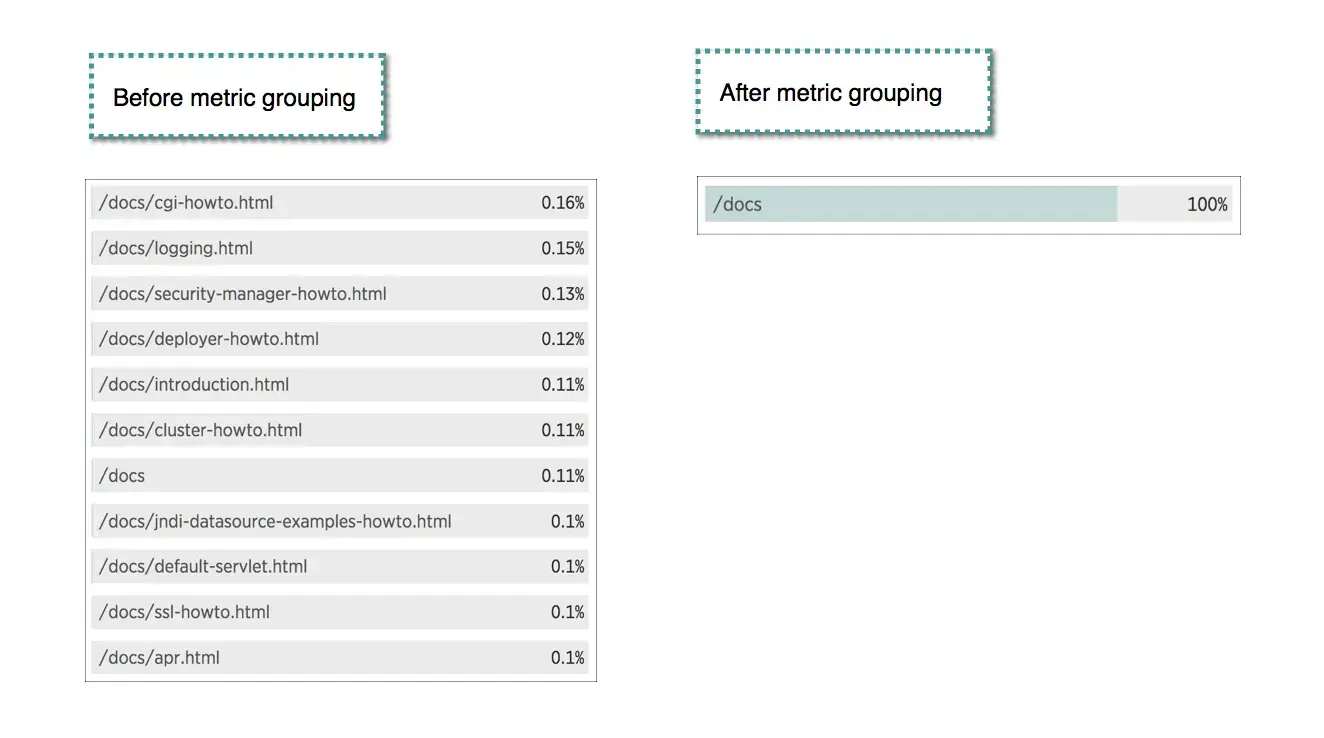
Here's a "before" and "after" example of how metric grouping can help organize transactions, to help you more easily identify patterns with performance problems.
To help prevent metric grouping issues from occurring in your app:
- Check the New Relic release notes to verify you're running the latest version of the New Relic agent.
- If needed, update your APM/mobile/browser agent to the latest version.
- Wait a few minutes, then look at new data in the New Relic UI.
- Check/Query
NrIntegrationErrorfor events with nameMetricCardinalityNearLimit. The creation of these events happens when your app is getting near the cardinality limit.
If the problem persists, follow the procedures for your agent:
Agent | Preventing MGIs |
|---|---|
All agents | Review the information about what causes metric grouping issues. |
Browser | |
Go | Rename your Go transactions. |
Java | |
.NET | Rename metrics with |
Node.js | Rename transactions with Request API calls. |
PHP | |
Python | Rename your Python transactions with |
Ruby |
You can also edit and create metric normalization rules in the UI. For more details, see Metric normalization.
Cause
Metric grouping issues occur when the granularity of metric names (most often web transaction names) is too fine, resulting in hundreds or thousands of different web transaction names for just a small number of code paths. A few major code paths may generate many different full URL paths to unique documents, articles, or page, etc., and if the unique element of the URL path is included in the transaction name, each of these common paths will have its own unique name.
To monitor and improve your application performance, it's much more useful to know the average performance for a function (for example, viewing articles on your site) than how quickly each individual article is displayed. To prevent metric grouping issues, New Relic will normally show a single entry for that function (for example, /article/view/*) on the APM Transactions page.
This grouping gives you a much better idea of how much time was spent viewing articles, and allows you to easily spot any performance problems related to viewing articles. If these statistics were spread across hundreds or thousands of transactions, detecting trends, regressions, or performance improvements would be extremely difficult.
Each APM agent has distinct ways of detecting controllers and frameworks. Most are automatic, but a few require you to enable or disable options in a config file. You can also follow our recommendations to help prevent metric grouping issues from occurring.