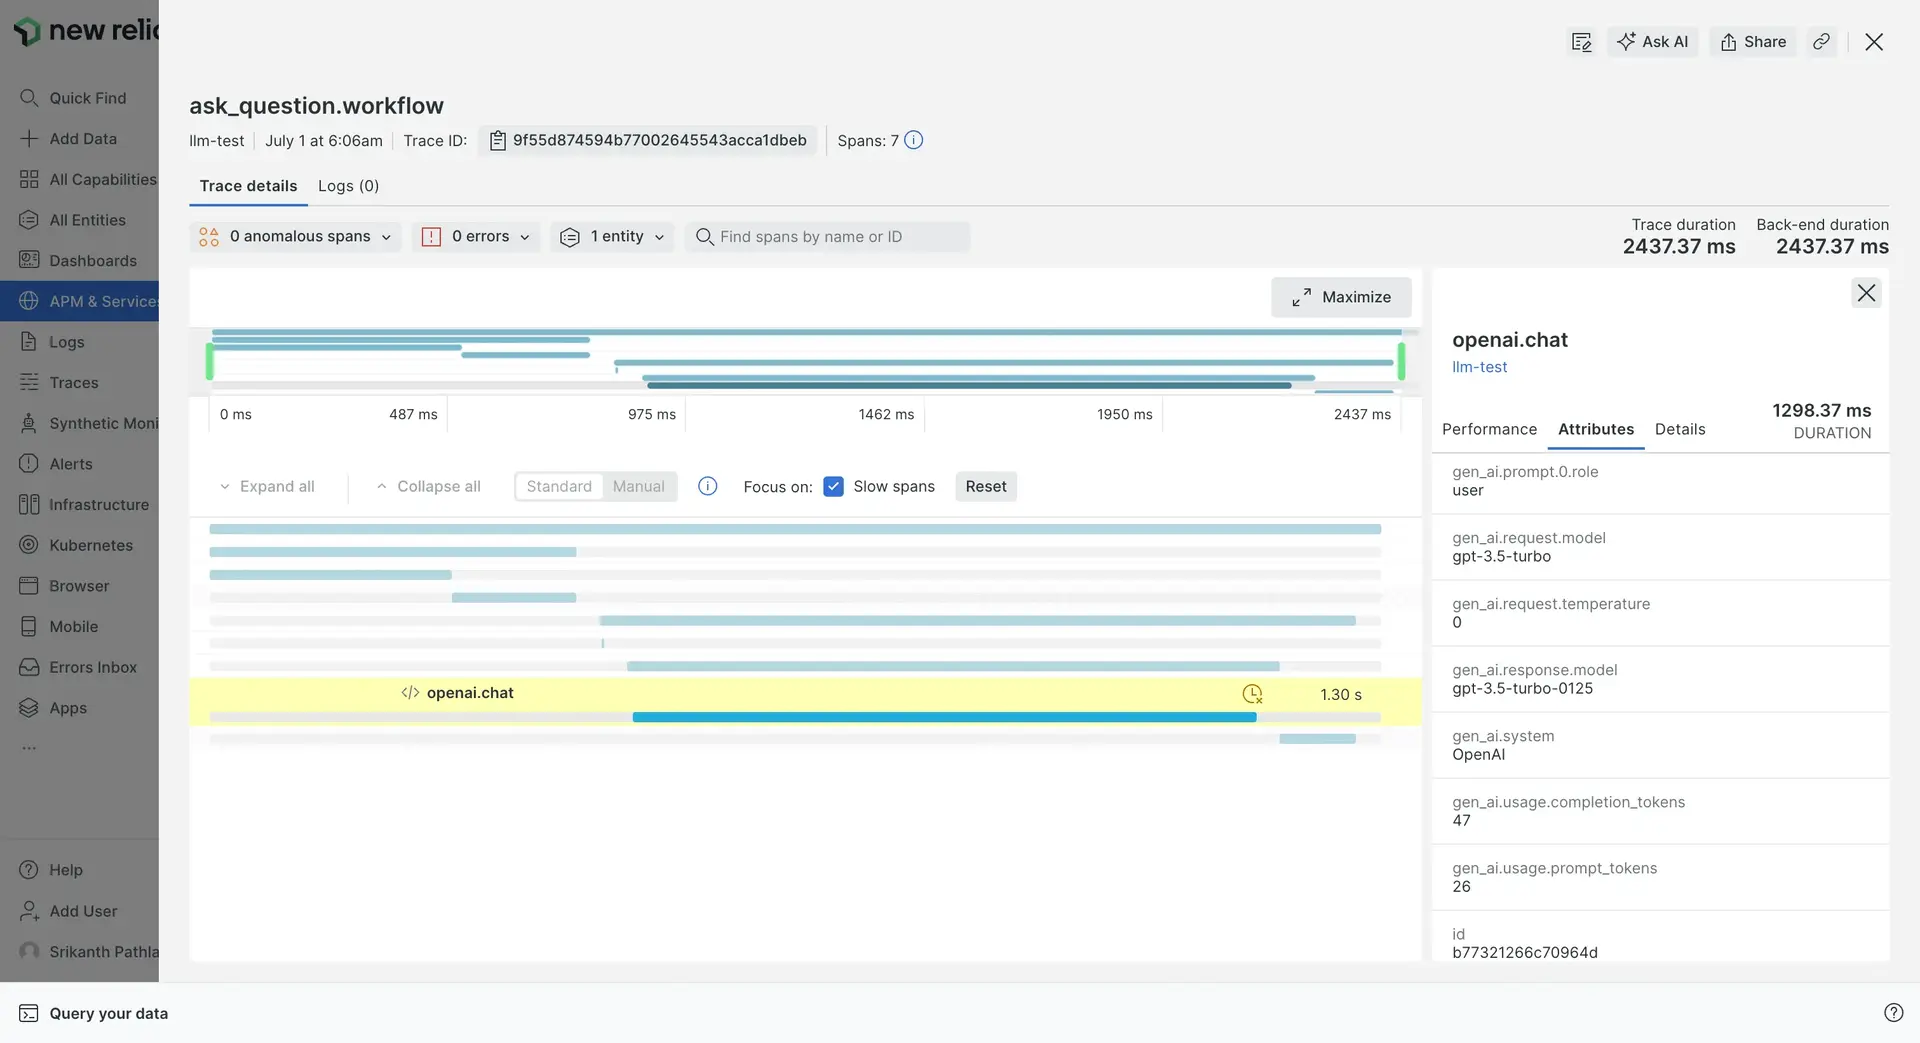
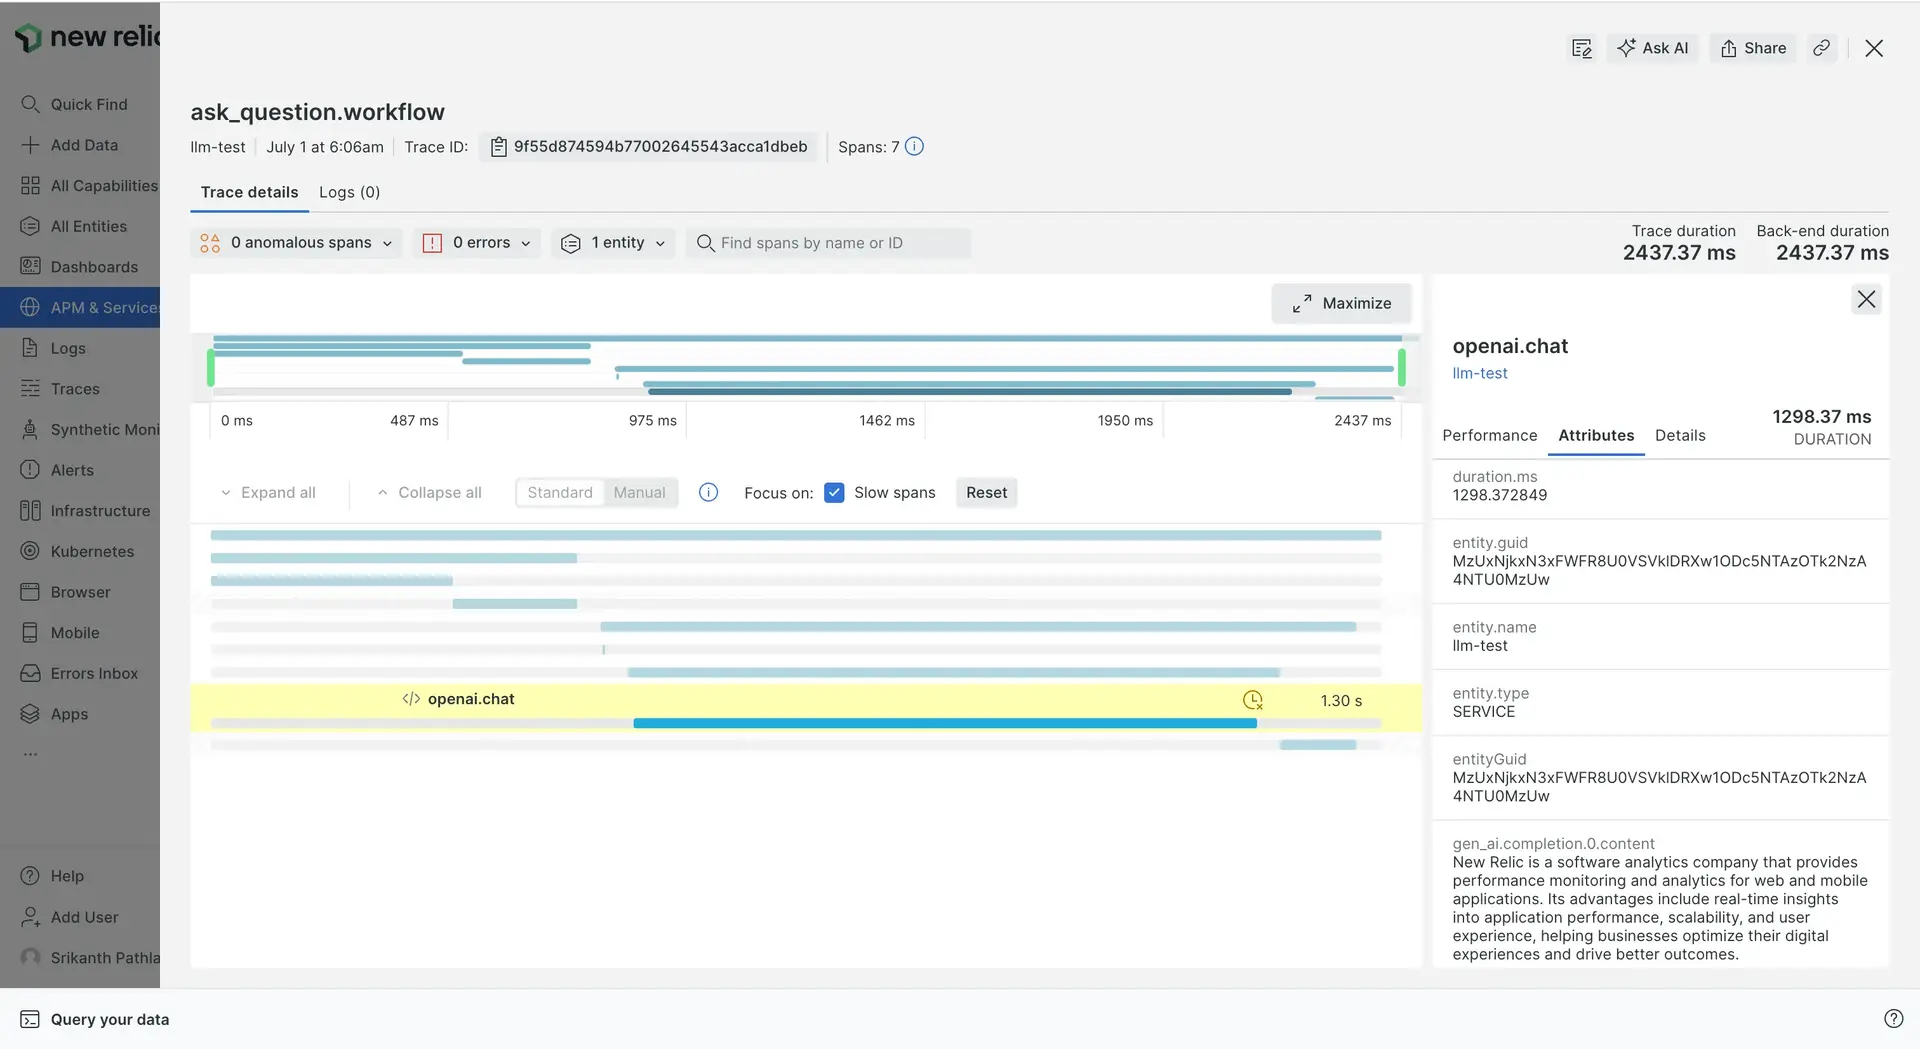
While OpenTelemetry offers a powerful standard for collecting general application data (traces, metrics, logs), it lacks the ability to capture key performance indicators (KPIs) specific to AI models. This includes crucial metrics like model name, version, prompt and completion tokens, and temperature parameters. These details are essential for effectively monitoring and troubleshooting AI model performance.

OpenLLMetry emerges as a solution, specifically designed to address this gap in AI model observability. Built on top of the OpenTelemetry framework, OpenLLMetry provides seamless integration and extends its capabilities. It offers support for popular AI frameworks like OpenAI, HuggingFace, Pinecone, and LangChain.
Key Benefits of OpenLLMetry:
- Standardized Collection of AI Model KPIs: OpenLLMetry ensures consistent capture of essential model performance metrics, enabling comprehensive observability across diverse frameworks.
- Deeper Insights into LLM Applications: With its open-source SDK, OpenLLMetry empowers you to gain thorough understanding of your Large Language Model (LLM) applications. This page describes common set up steps for OpenTelemetry based APM monitoring with New Relic.
OpenLLMetry empowers developers to leverage the strengths of OpenTelemetry while gaining the additional functionalities required for effective AI model monitoring and performance optimization.
Before you start
- Sign up for a New Relic account.
- Get the license key for the New Relic account to which you want to report data.
Instrument your LLM Model with OpenLLMetry
Since New Relic natively supports OpenTelemetry, you just need to route the traces to New Relic’s endpoint and set the API key:
TRACELOOP_BASE_URL = https://otlp.nr-data.net:443TRACELOOP_HEADERS = "api-key=<YOUR_NEWRELIC_LICENSE_KEY>"- The OpenTelemetry Protocol (OTLP) exporter sends data to the New Relic OTLP endpoint.
Example: OpenAI LLM Model with LangChain
from traceloop.sdk import Traceloopimport osimport timefrom langchain_openai import ChatOpenAIfrom traceloop.sdk.decorators import workflow, task
os.environ['OPENAI_API_KEY'] = 'OPENAI_API_KEY'os.environ['TRACELOOP_BASE_URL'] = 'https://otlp.nr-data.net:443'os.environ['TRACELOOP_HEADERS'] = 'api-key=YOUR_NEWRELIC_LICENSE_KEY'
Traceloop.init(app_name="llm-test", disable_batch=True)
def add_prompt_context():  llm = ChatOpenAI(      model="gpt-3.5-turbo",      temperature=0)  chain = llm  return chain
def prep_prompt_chain():  return add_prompt_context()
def prompt_question():  chain = prep_prompt_chain()  return chain.invoke("explain the business of company Newrelic and it's advantages in a max of 50 words")
if __name__ == "__main__": print(prompt_question())View your data in the New Relic UI
Once your app is instrumented and configured to export data to New Relic, you should be able to find your data in the New Relic UI:
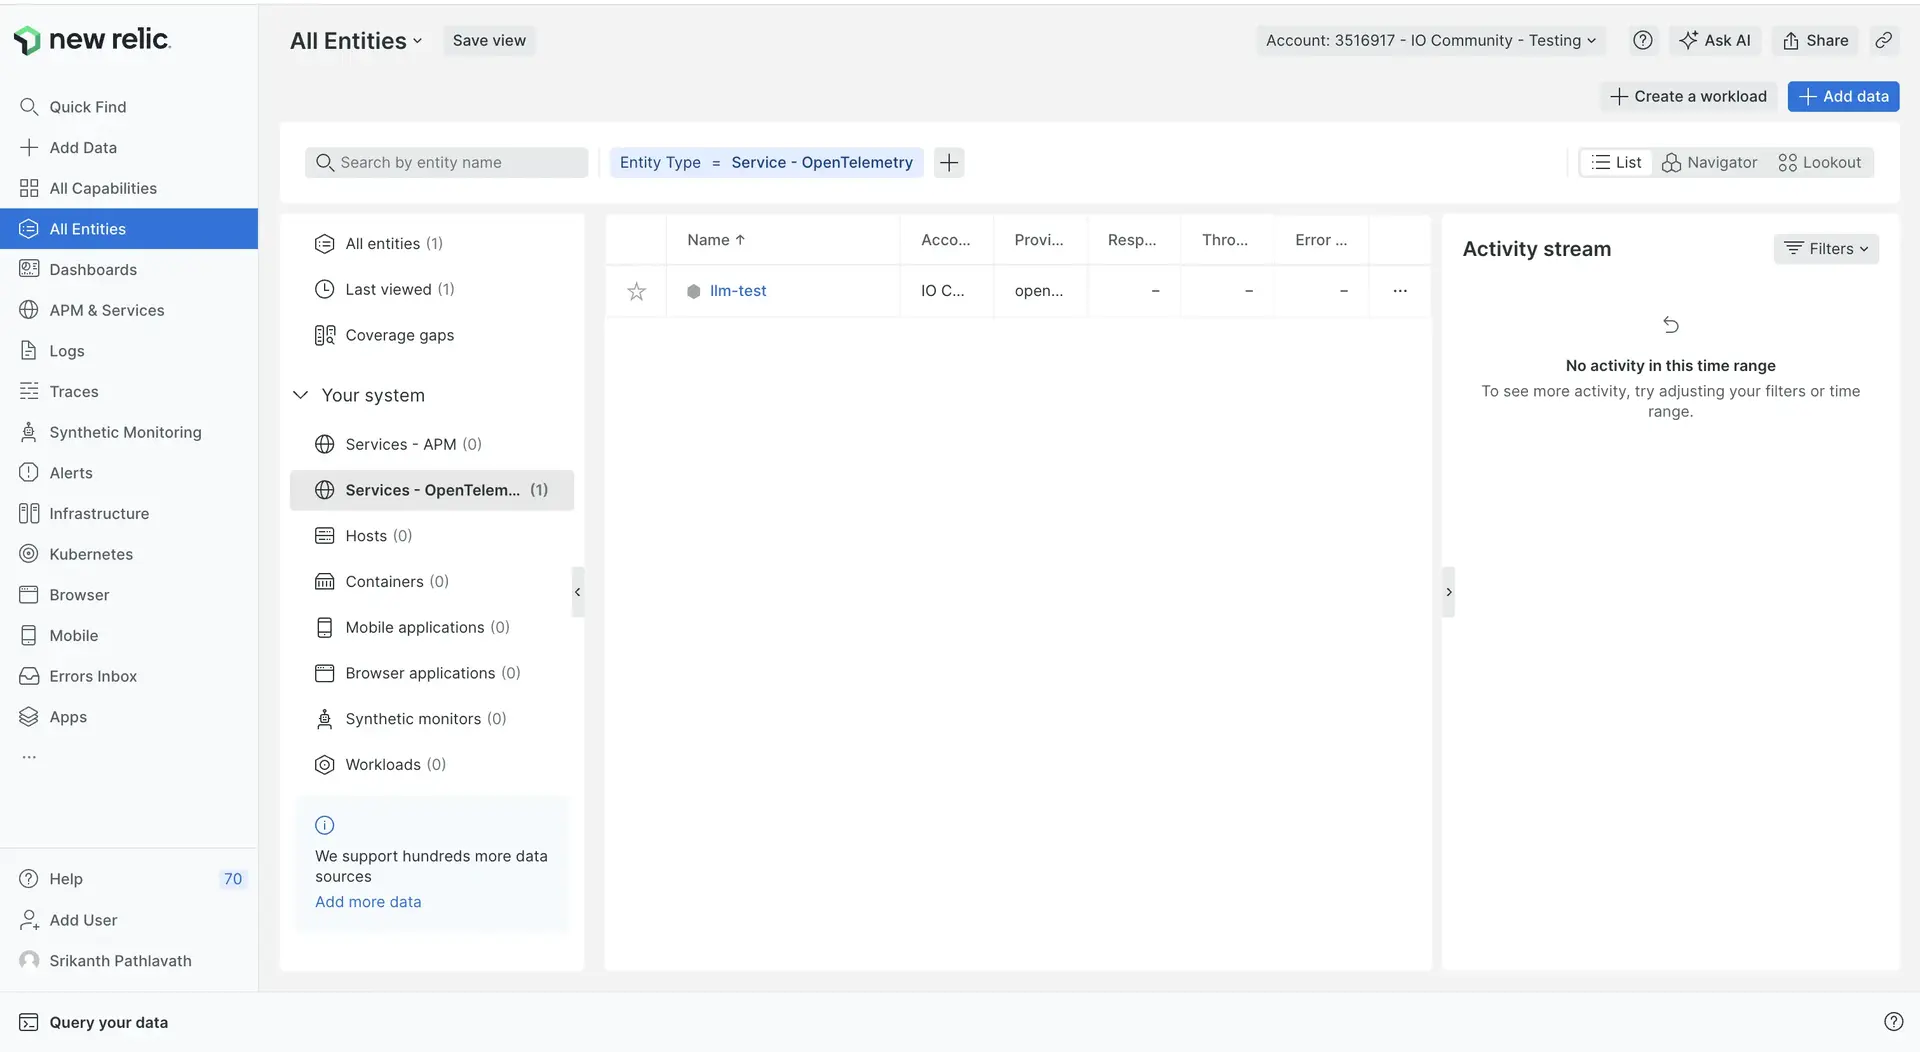
Find your entity at All entities -> Services - OpenTelemetry. The entity name is set to the value of the app's
service.nameresource attribute. For more information on how New Relic service entities are derived from OpenTelemetry resource attributes, see Services

See OpenTelemetry APM UI for more information.
If you can't find your entity and don't see your data with NRQL, see OTLP troubleshooting.
Este documento ajudou você na instalação?