One of the promised outcomes of implementing service levels is that you'll be able to adjust your alert policies and cut notifications down to those issues that are actually damaging your client experience, and pose a risk to your business.
When you set service level objectives, you can configure that will inform you in case of exhaustion of your error budget before the end of the compliance period. These alerts will show you when high business impact incidents occur. When triggered, they should be given priority, and you should engage the relevant teams to start diagnosing the source of the problem.
Alerting on error budget burn rate
The idea behind burn rate alerts is that the error budget represents how many bad events you can afford over the SLO period; by definition, if you spend all your error budget at a constant rate, your burn rate = 1. Then, any burn rate above the tolerable burn rate would not be sustainable because you would have completely burnt the error budget before the end of the SLO period; therefore, you might want to get alerted if that's the case for a continued amount of time.
Create alerts on error budget burn rate
You'll find the option to create alerts on the service level summary and alert conditions pages.
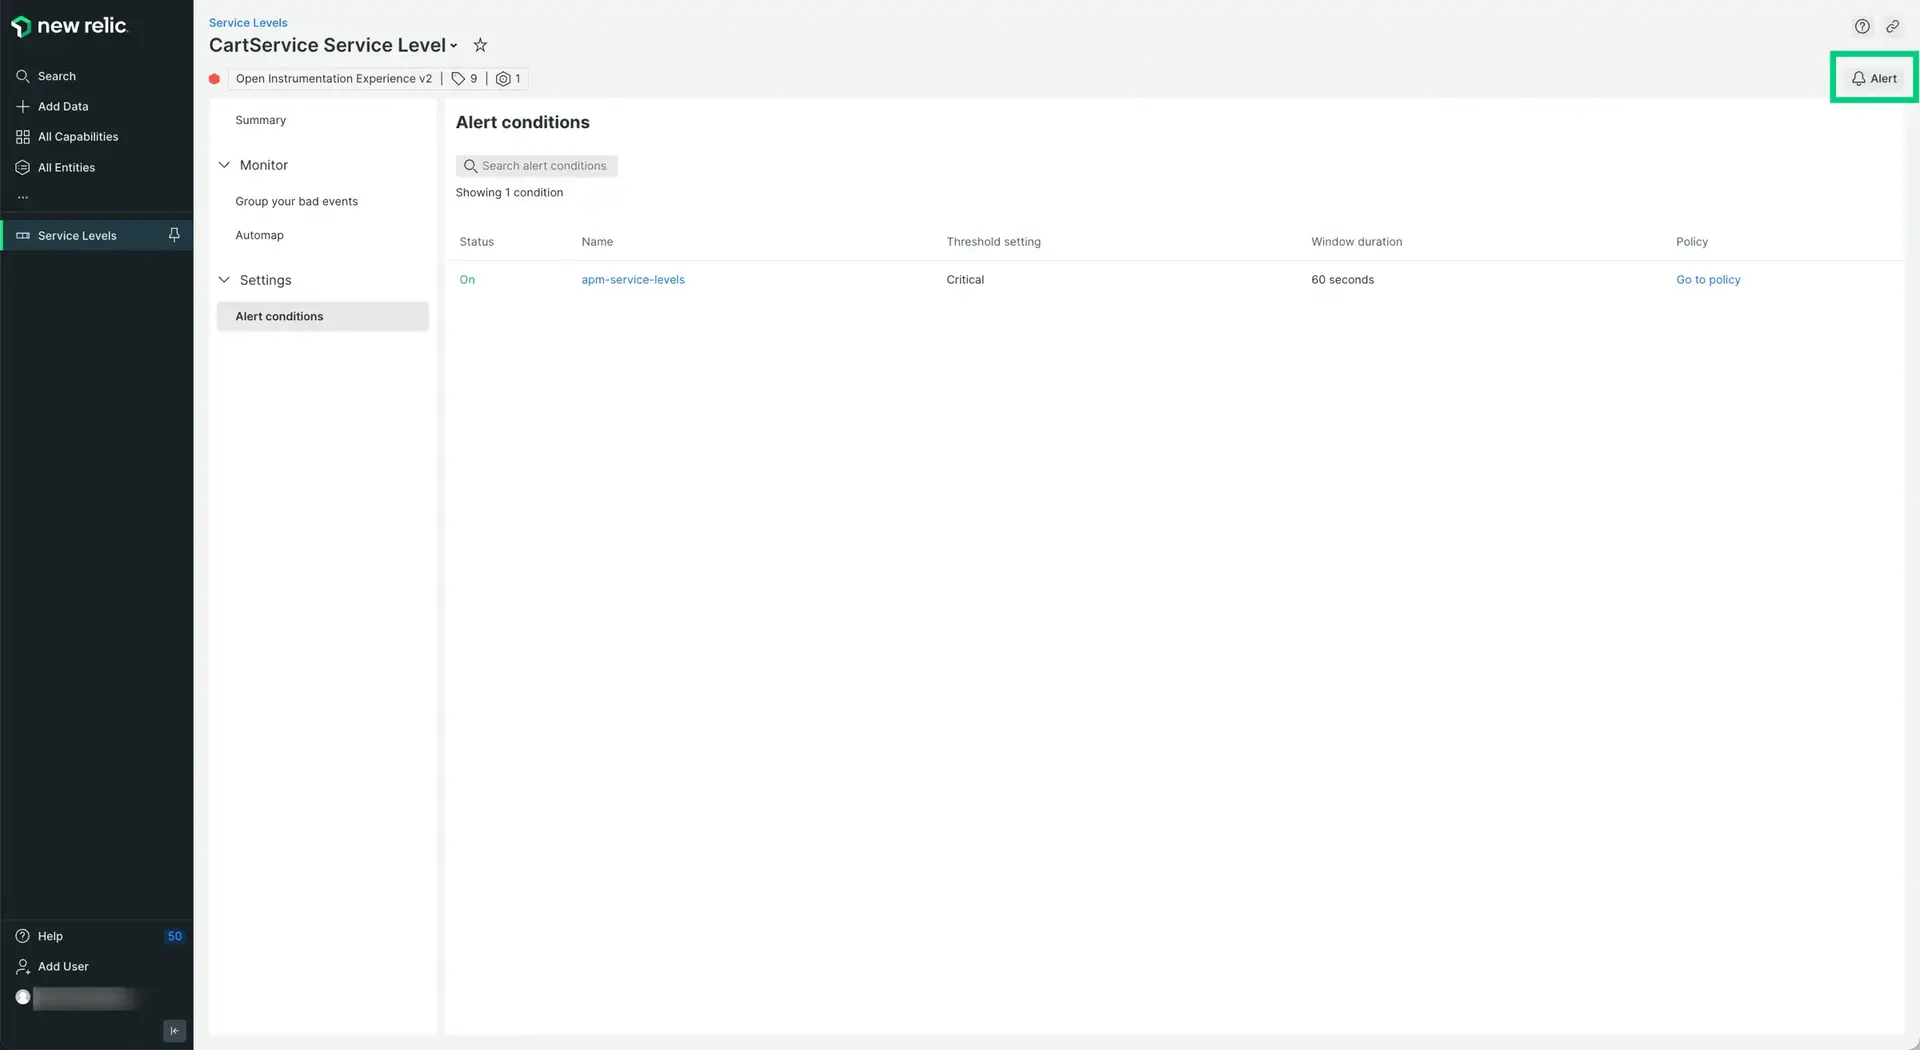
Go to one.newrelic.com > All capabilities > Service Levels > Choose a service level and then click Alert conditions under the Settings option.
When clicking on it, a side panel will open, and you'll see the option to alert on the fast-burn rate at the top of the list and slow-burn beneath it.
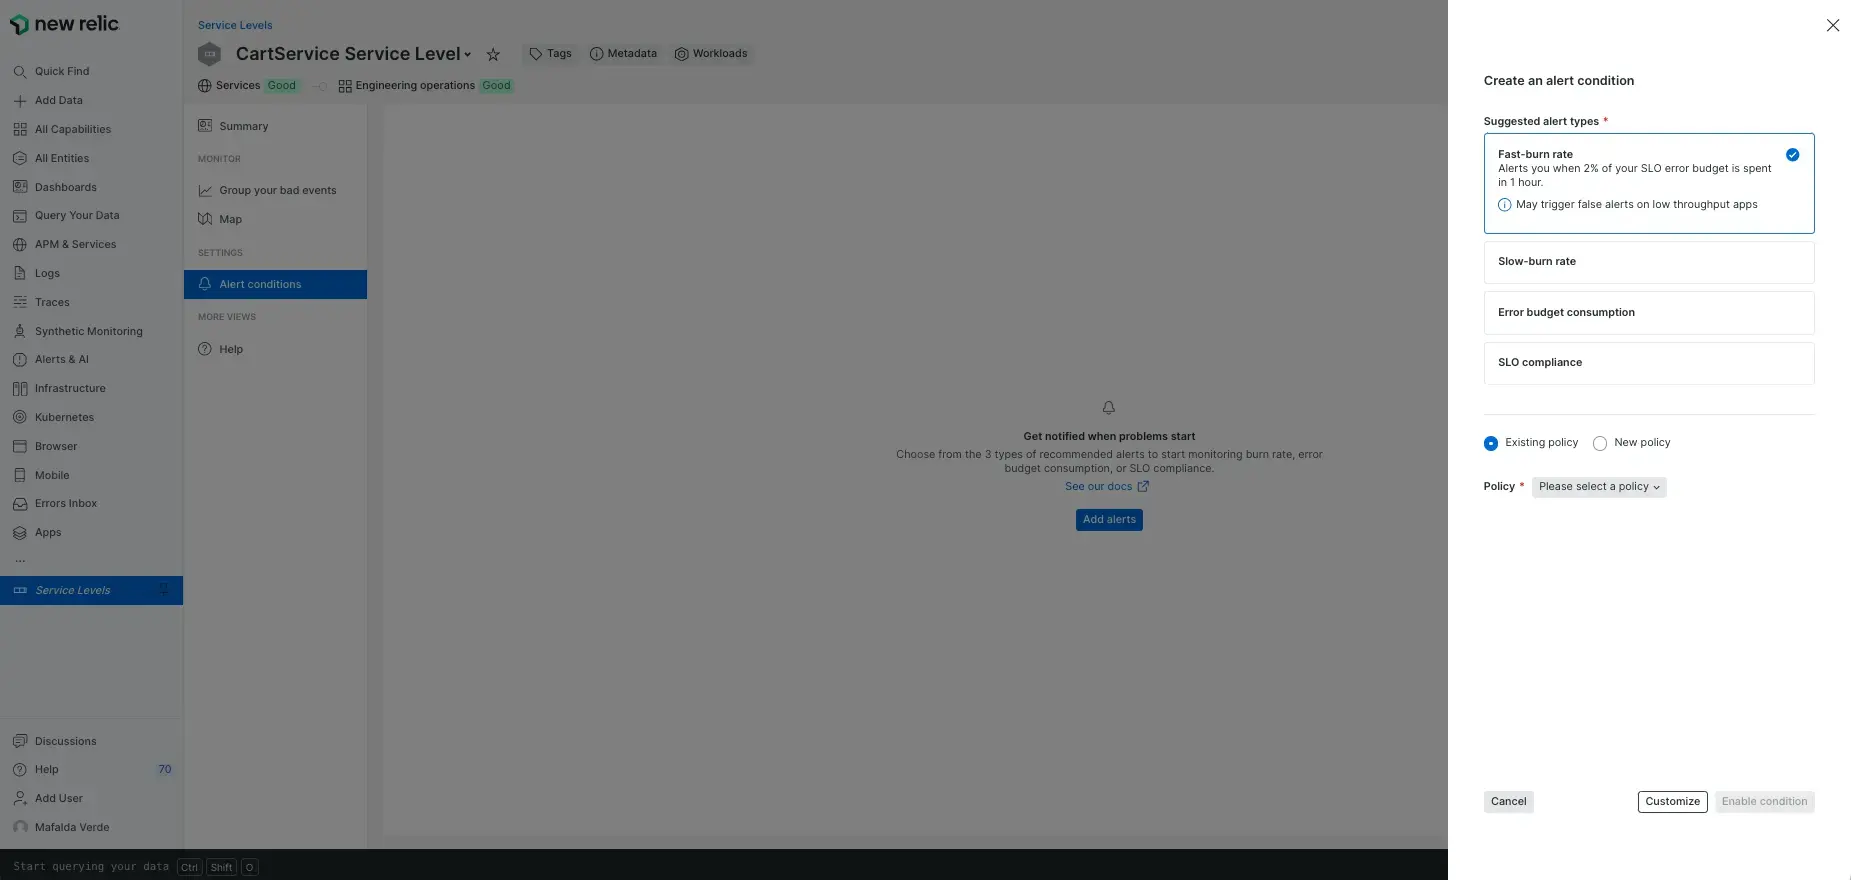
Go to one.newrelic.com > All capabilities > Service Levels > Choose a service level and then click Alert conditions under the Settings option. Click the Alert button to open the side panel.
The fast-burn alert follows Google's recommendation for SLO budget consumption percentages, specifically for fast-burn alerts. These alerts will warn you of a sudden, significant change in consumption that, if uncorrected, will exhaust your error budget very soon. We'll set a 2% SLO budget consumption within 1 hour, meaning the service would consume the error budget entirely in 50 hours if left unattained.
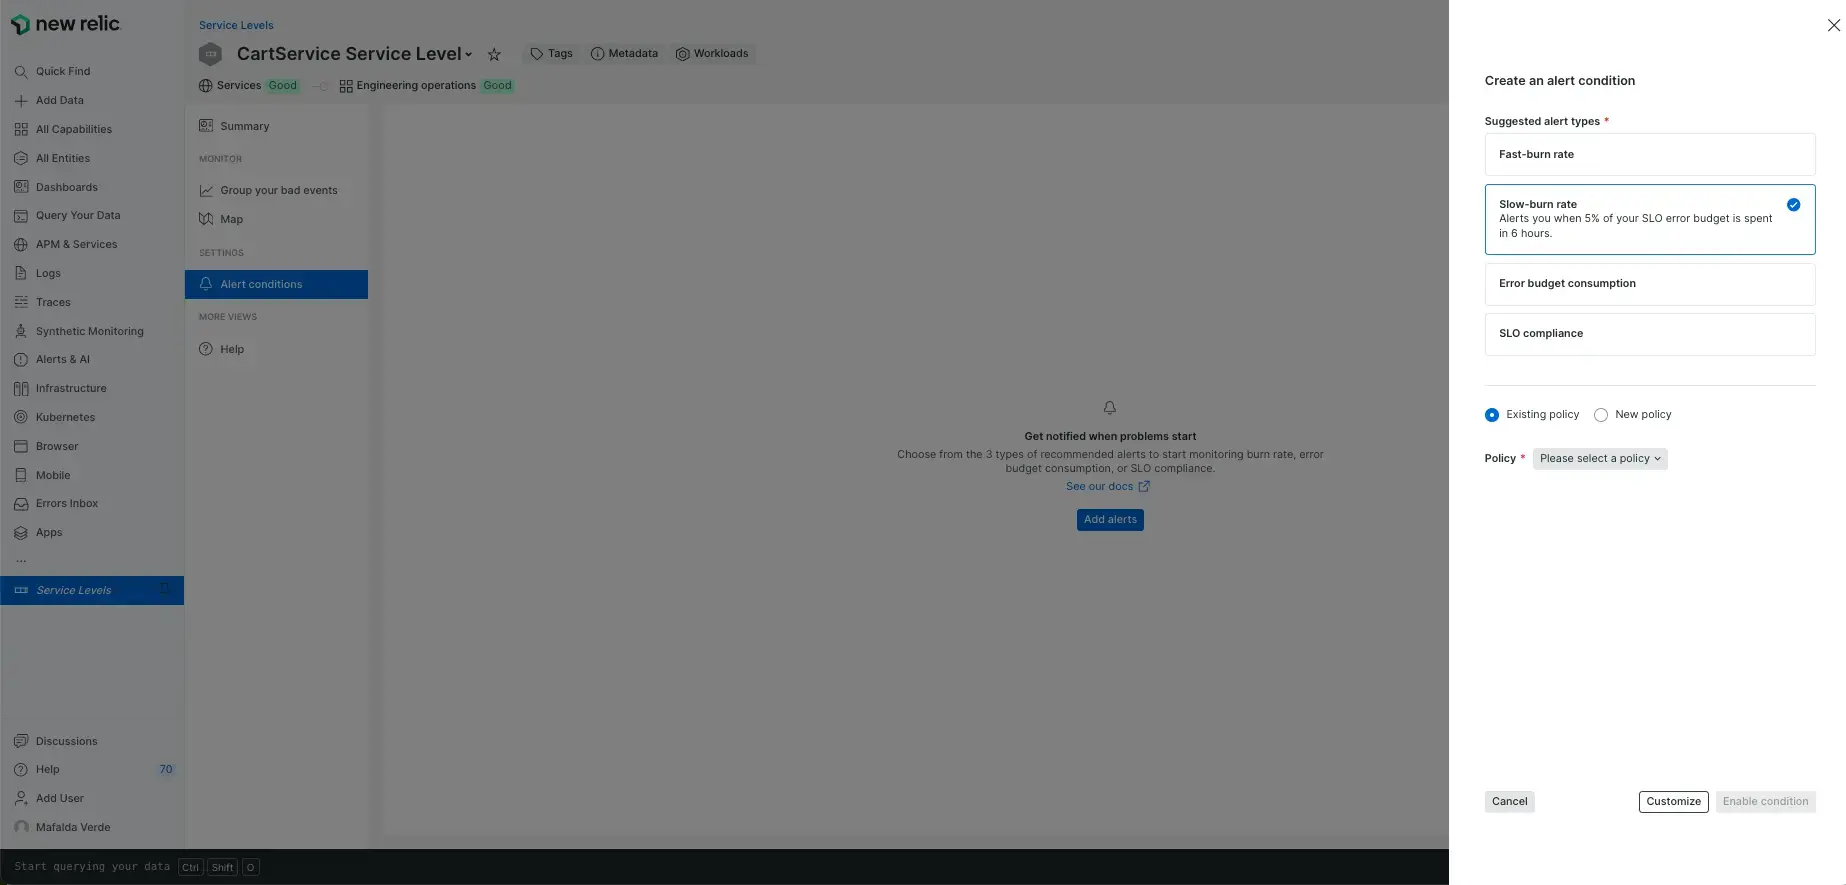
Go to one.newrelic.com > All capabilities > Service Levels > Choose a service level and then click Alert conditions under the Settings option. Click the Alert button to open the side panel.
The slow-burn alert follows Google's recommendation for SLO budget consumption percentages, specifically for slow-burn alerts. These alerts will warn you of a change in consumption that, if not altered, will exhaust your error budget before the end of the compliance period. We'll set a 5% SLO budget consumption within 6 hours, meaning the service would consume the error budget entirely in 5 days if left unattained.
You'll need to select an existing alert policy or create a new one to continue.
Alternatively, you can click 'Customize' and set your own thresholds.
Alerting on error budget consumption
This alert will warn you once you've consumed 80% of your error budget for the period.
To set it up, click Alert on the service level summary or alert conditions pages, and select the Error budget consumption option.
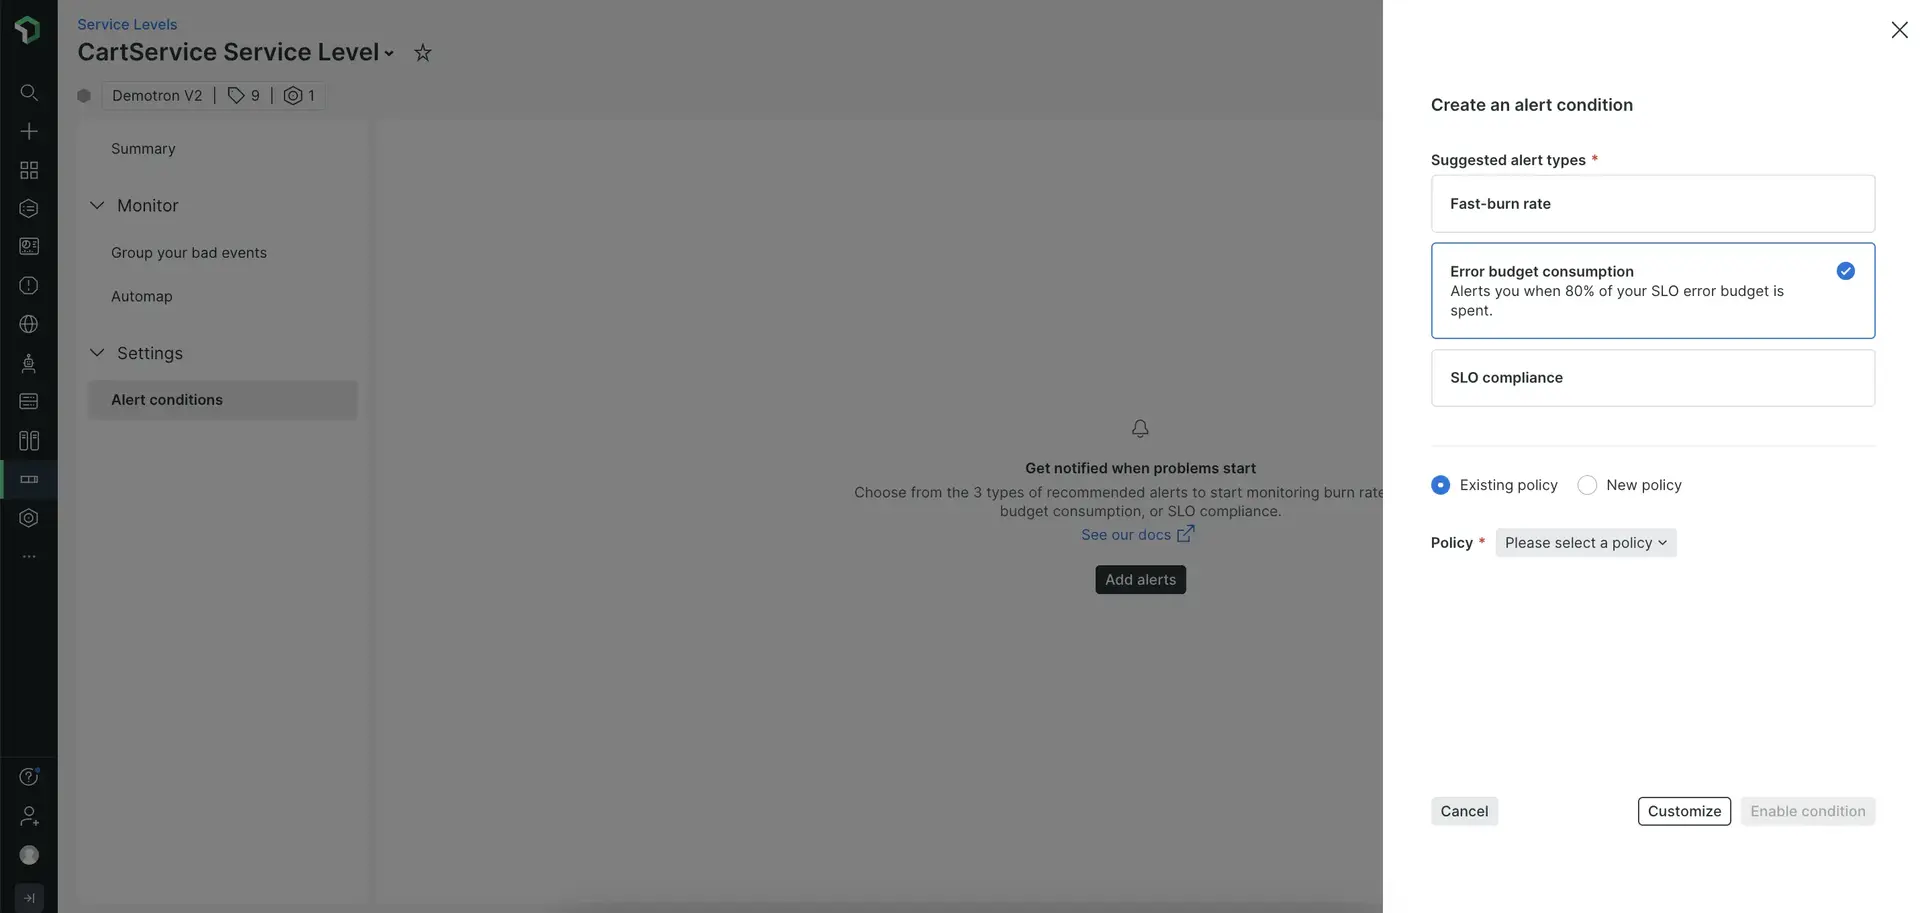
Go to one.newrelic.com > All capabilities > Service Levels > Choose a service level and then click Alert conditions under the Settings option. Click the Alert button to open the side panel.
You'll need to select an existing alert policy or create a new one to continue.
If you want to set a different threshold, click Customize and follow the steps on the alert configuration card.
Alerting on SLO compliance
If you want to set up an alert for when your SLO goes below its target for an extended period, you can select the SLO compliance option.
If your SLI is volatile, this type of alert might have low precision. Therefore, you should use a burn rate alert instead to mitigate it.
Setting up your own error budget burn rate thresholds
If you don't want to follow Google's recommendation for fast-burn alerts, you can set up your own thresholds.
Set your condition thresholds
The error budget burn rate indicates how fast the service consumes the error budget, taking into account the whole SLO period. Here's a formula for calculating it:
critical burn rate = (tolerated budget consumption * SLO period [h]) / (evaluation period [h])- Tolerated budget consumption: How much budget you tolerate to consume in the evaluation period.
- SLO period: time window of your SLO (generally, in hours).
- Evaluation period: aggregation window we are taking into consideration (you can use 1 hour on the alert condition aggregation window for simplicity).
However, considering that the maximum error rate that can ever occur is 100%, it means that there's also a maximum burn rate and therefore the critical burn rate must be in the range of:
0 < critical burn rate < maximum burn rateWhere the maximum burn rate value is calculated as follows:
maximum burn rate = 1 / (1 - SLO target)Finally, in order to define your alert threshold, you will multiply the critical burn rate per hour by the error budget:
threshold = error budget * critical burn rateExample
Let's see how this works with an example for a 28 day SLO with a 99.9% target.
For a 28 day SLO, Google recommends alerting on a 2% SLO budget consumption in the last hour. That means that if you keep burning the budget at the same rate, you would breach your SLO in 50 hours (resulting from 100% / 2%).
Then we have the following variables:
- SLO target:
99.9% - SLO period:
28 days (28 * 24 hours) - Tolerated budget consumption:
2% (0.02) - Evaluation period:
1 hour
Therefore:
critical burn rate per hour = (0.02 * 28 * 24) / 1 = 13.44Where the maximum possible burn rate value for the SLO is:
maximum burn rate = 1 / (1 - 0.999) = 1000And finally:
threshold = 0.1 * 13.44 = 1.344This would be a value that you would use as the alert condition threshold: Open an incident when the query returns a value above the threshold (in this example, 1.344), at least once in the evaluation period (in this example, 60 minutes).
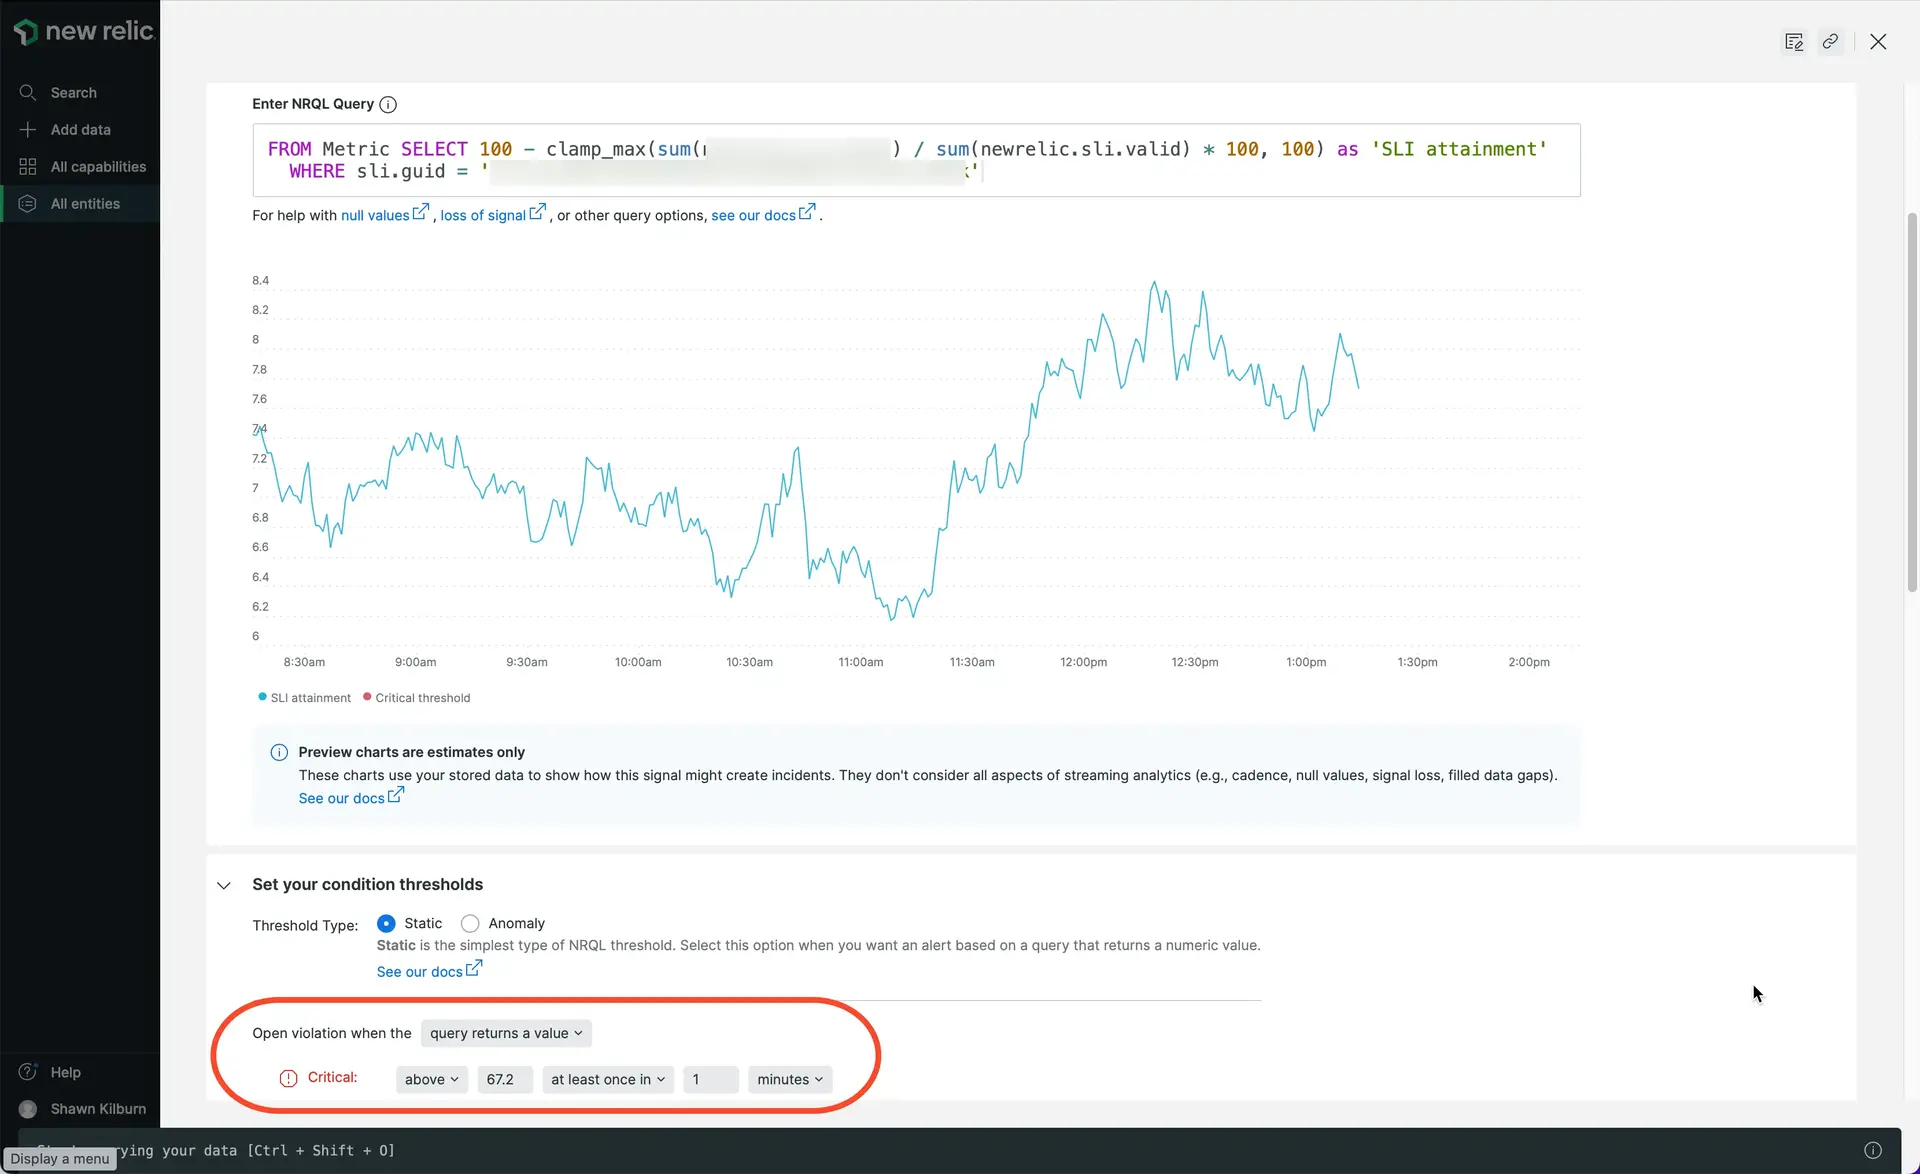
Importante
If you edit the SLO target on the Service levels side, remember to edit the target on the alert condition as well.
Settings
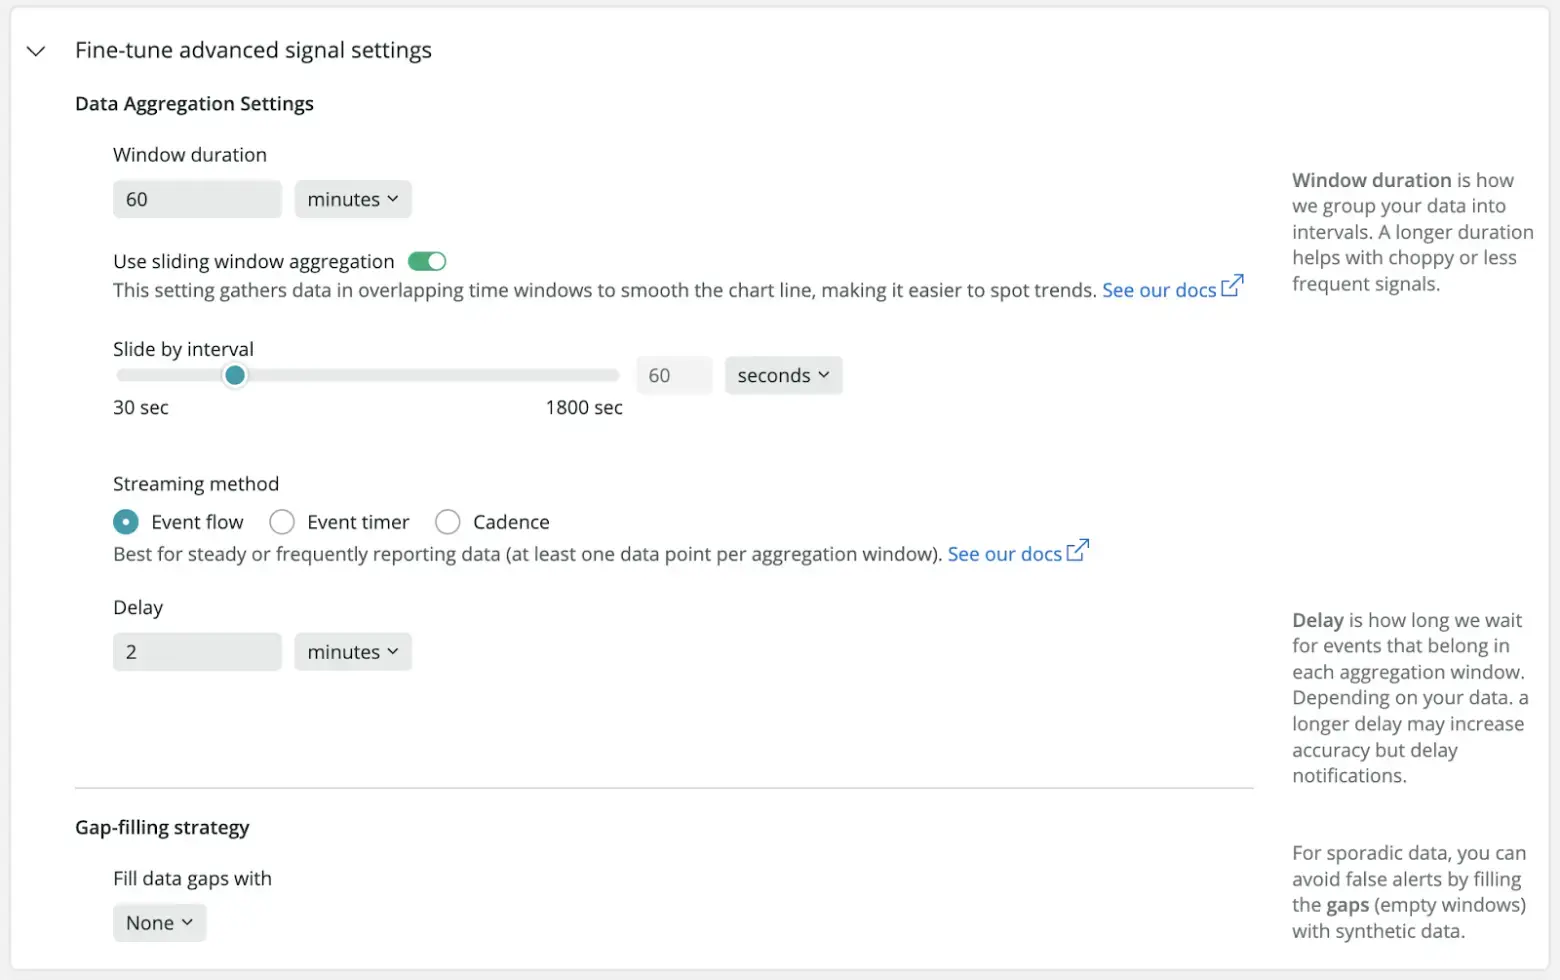
It's important to tune the additional parameters of this alert condition.
Set the window duration to the evaluation period. Following the previous example, you would set 60 minutes, meaning the alert system would aggregate 60 minutes of data.
Importante
The evaluation period supports aggregating up to 6 hours of data.
You can use a 60 seconds slide by interval, so that every minute New Relic evaluates the 60 previous minutes of data.
Next, connect the condition to the policy that determines how notifications are managed.
Last, you can choose when to automatically close any open incidents.
Understand the service levels default alert policy
The service levels default alert policy was introduced, at account level, so that the service levels health status is based on its remaining error budget. This improves your experience when using other New Relic products, such as New Relic Navigator and workloads.

This alert policy will not trigger any notifications, and in case you prefer not to have the entity health based on its error budget consumption, you can easily delete this policy. Although, deleting the policy is permanent, and it will affect existing and new service levels for that account.
