Orchestrated components consist of entire deployments that spin pods up and down as needed. In a Kubernetes system, individual deployments have specific configurations. For example, a deployment might run four instances of an application in individual containers. The deployment will spin up pods containing that application until it meets that quota. If a pod were to fail, it would spin up a new one to continue to meet the specified number.
Issues arise when deployments you have dozens or hundreds of deployments, each with configurations you might not even remember.
The following steps guide you through a general strategy to monitor your deployments:
Navigate to the overview dashboard
Go to one.newrelic.com > All capabilities > Kubernetes > Overview Dashboard.
Triage your deployments
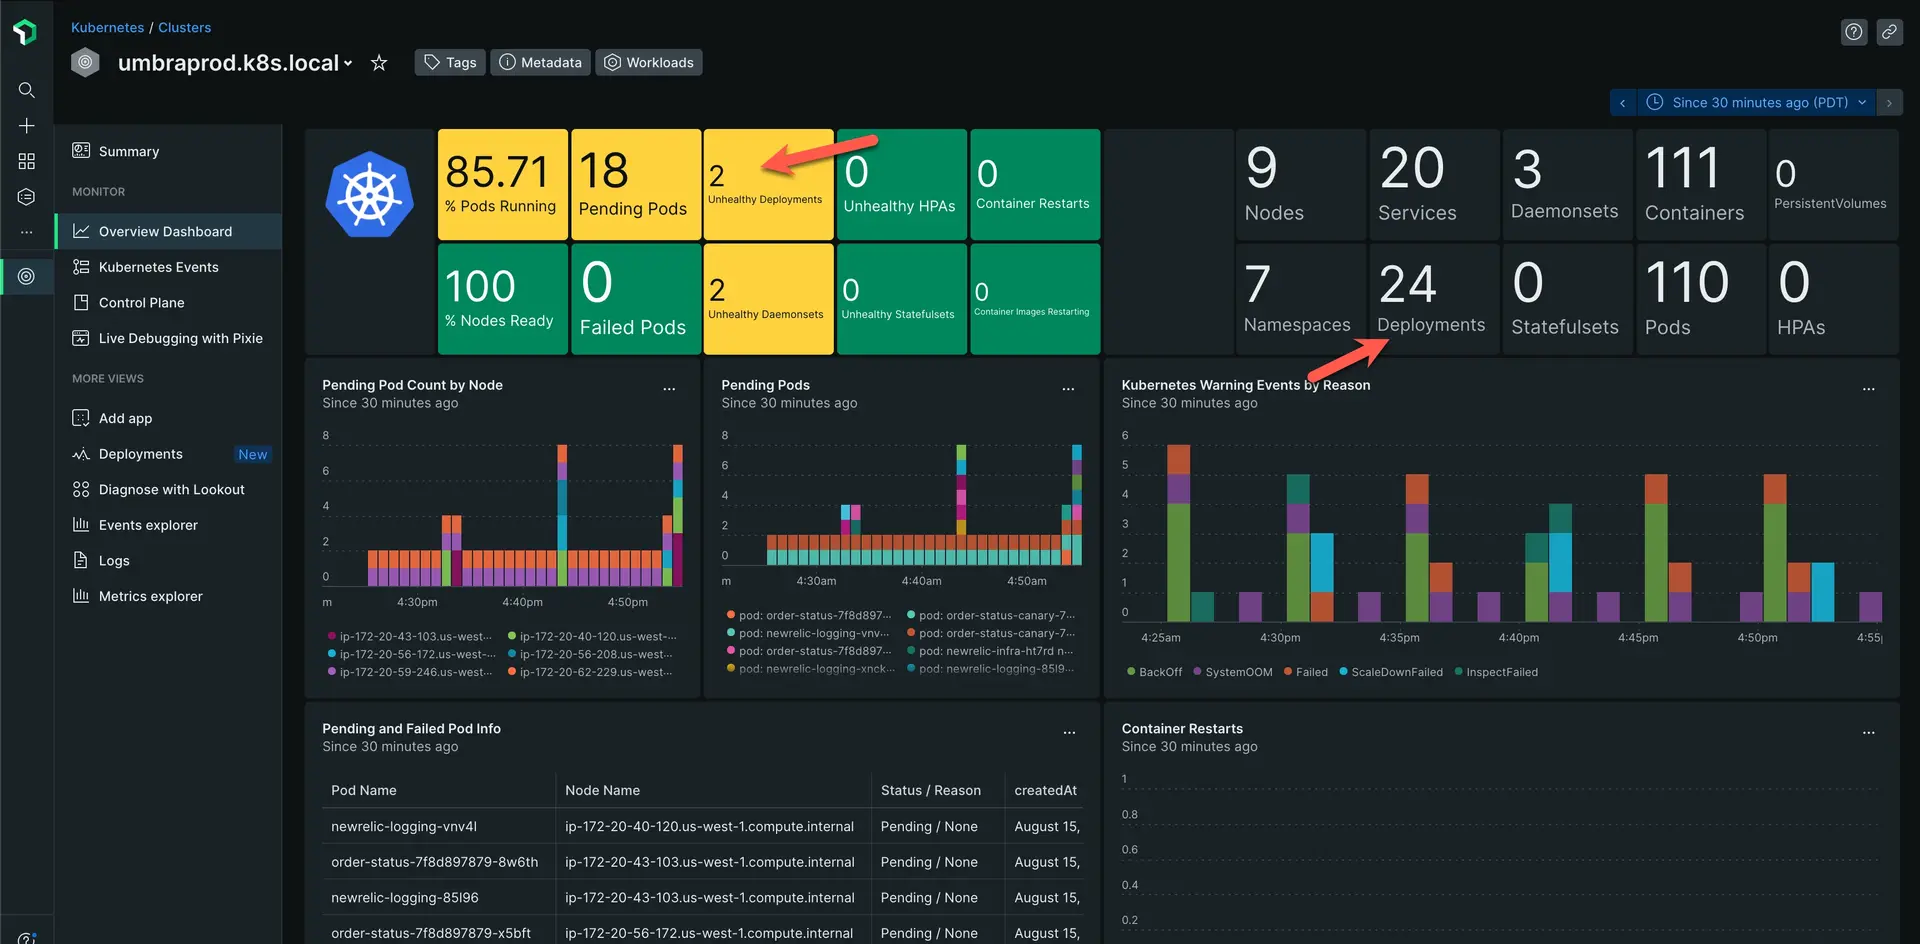
Take a look at the unhealthy deployment tile and the deployment count tile.
Compare the two to measure the percentage of unhealthy deployments in your cluster. Unhealthy deployments have missing or unavailable pods. This usually means that the deployment was unable to spin up those pods.
Let's take a close look.

Identify pending and failed pods
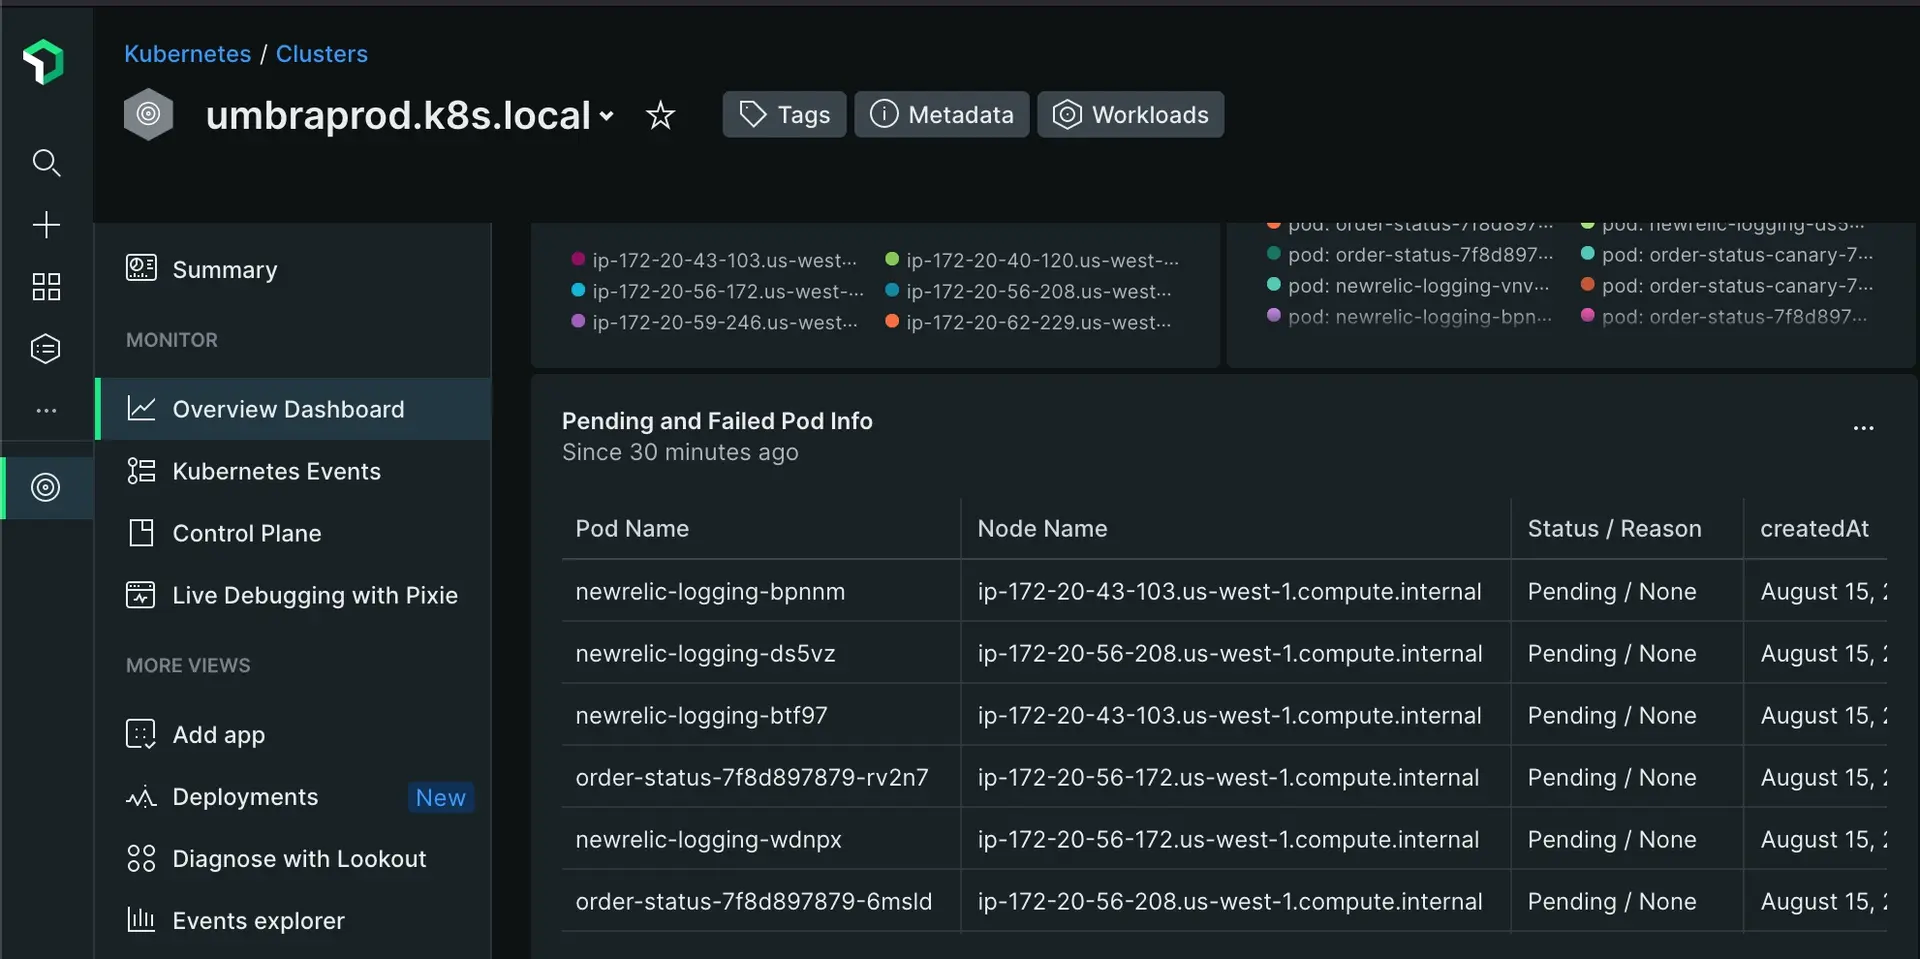
Scroll down a bit and find the Pending and Failed Pods table. This table will show you all the pods that have failed or are stuck pending for whatever reason. It's normal that pods fail at to a certain degree depending on the baseline health of your system.
What you're looking for is pods that repeatedly fail. Scroll down the chart as needed.

Once you've identified which pods fail regularly, troubleshoot the deployment configs for those pods.