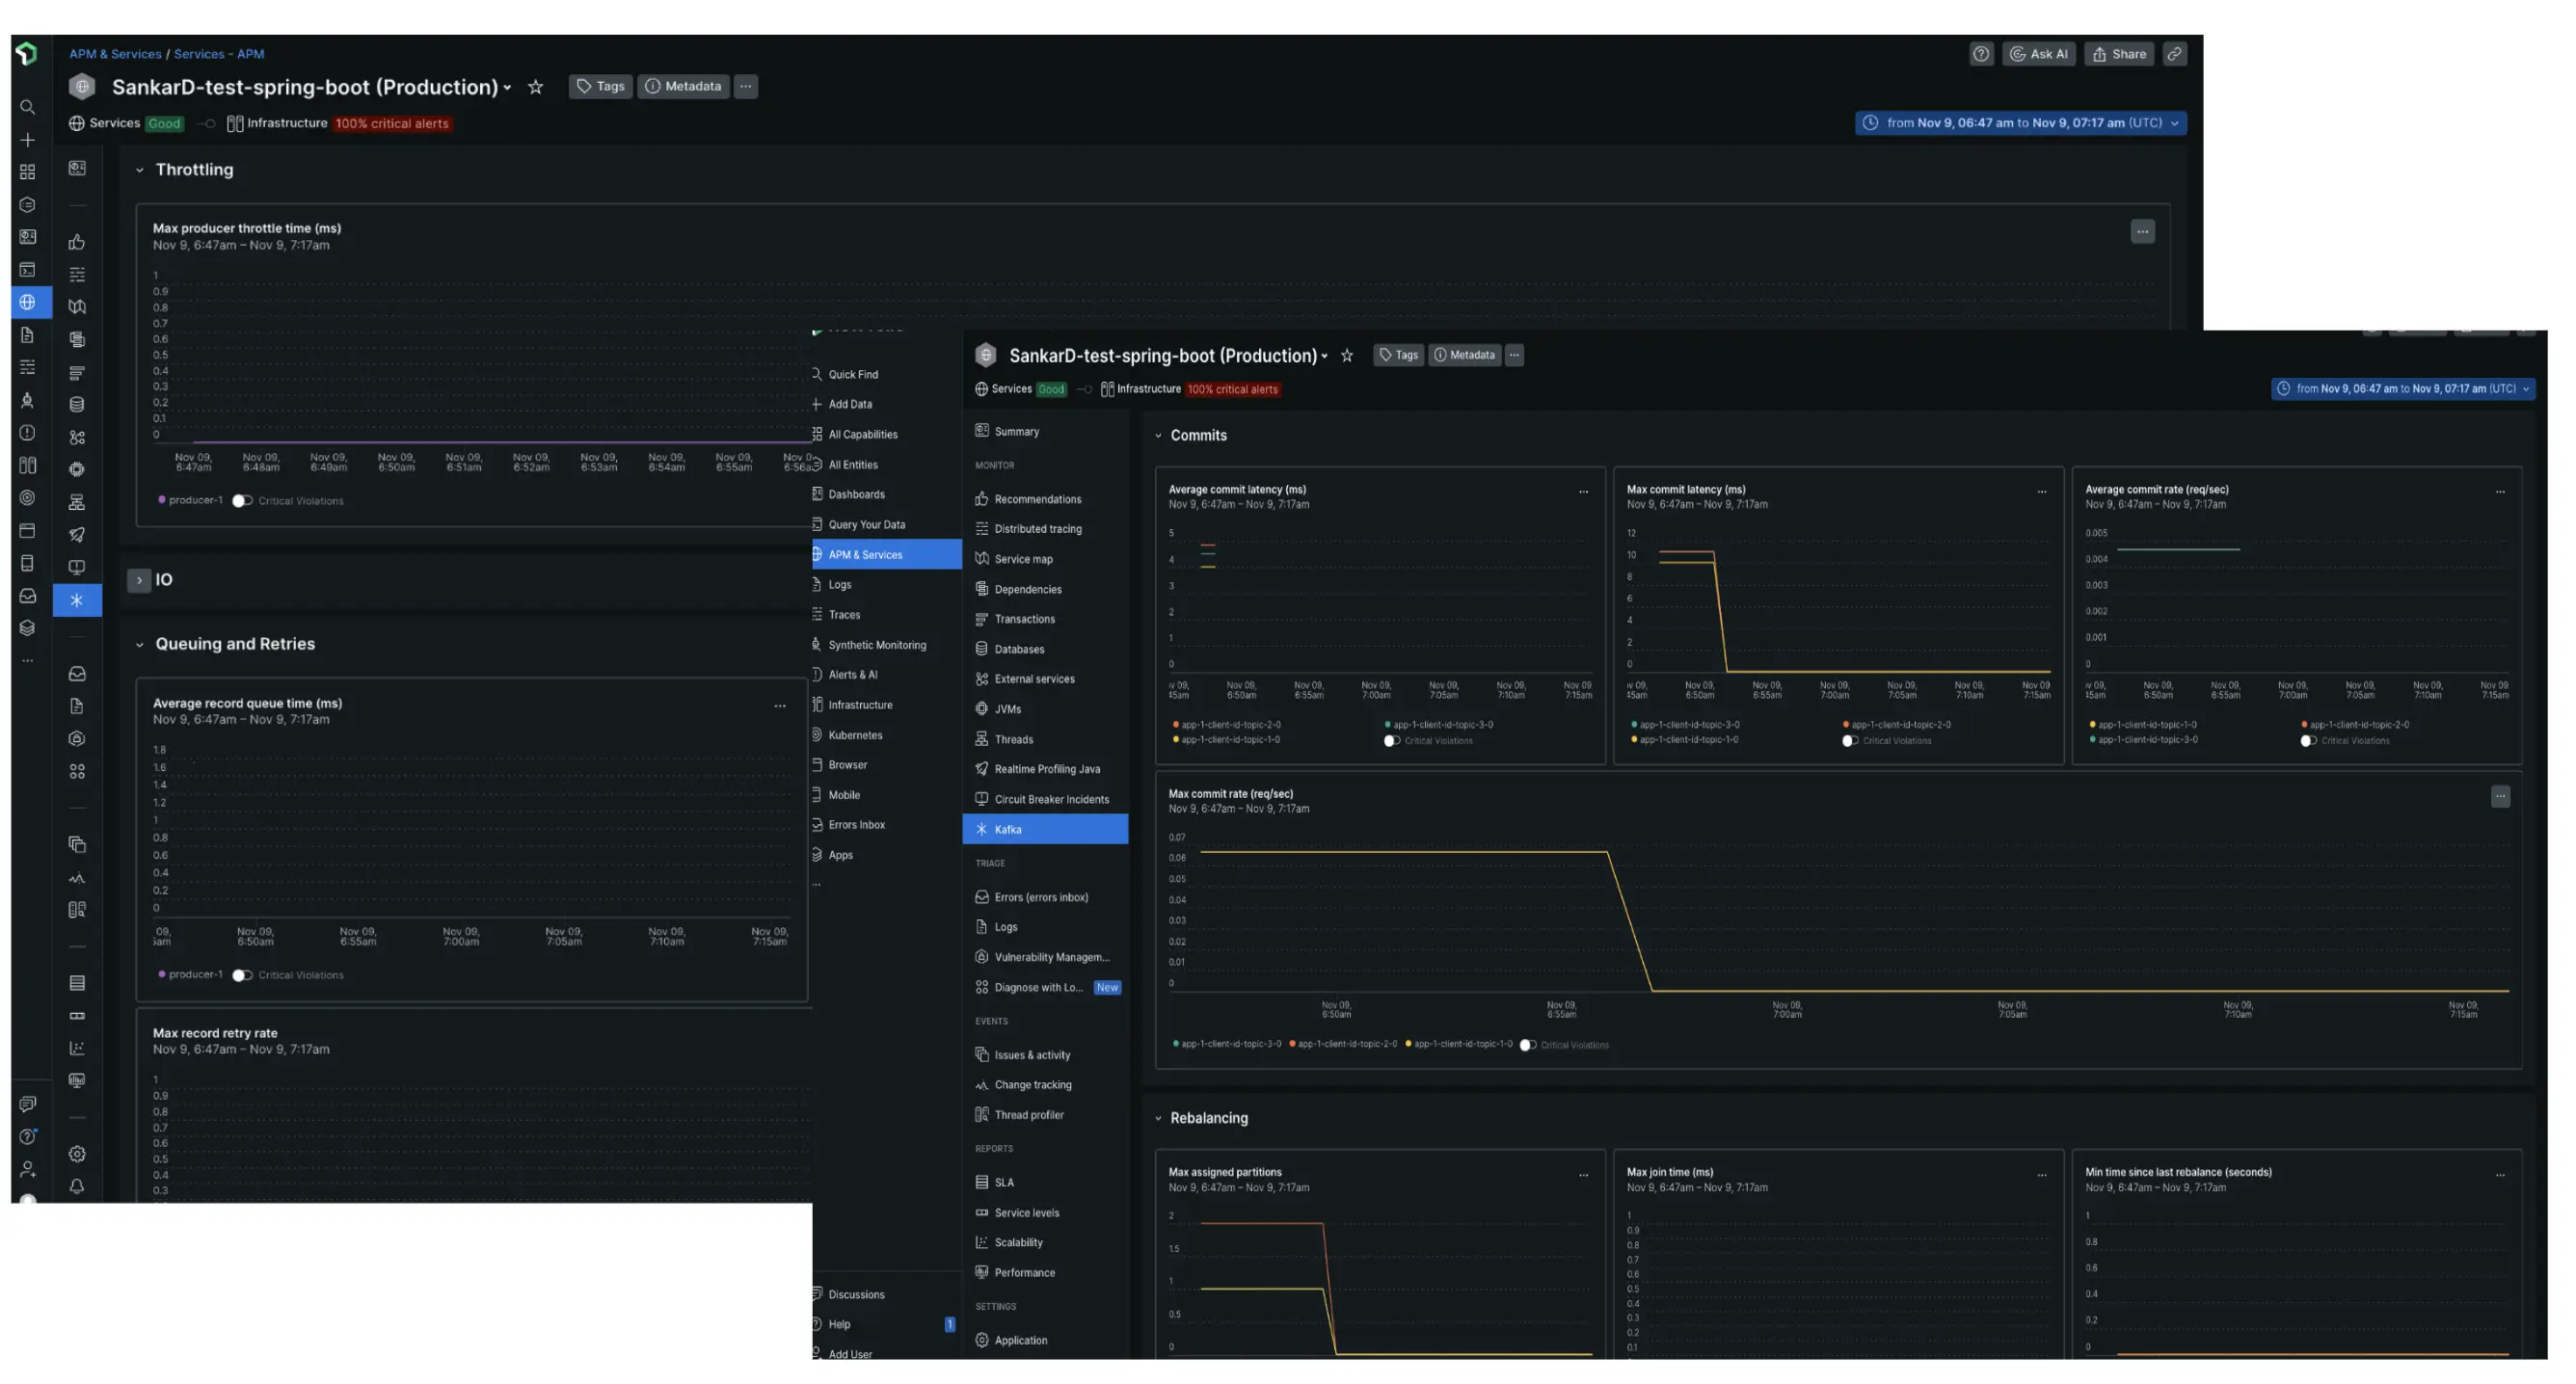
At New Relic, we run high-throughput Kafka clusters, and know firsthand the challenge of managing them. That's why we built an intuitive Kafka UI as part of New Relic APM 360. Now you have unparalleled insights and control over your Kafka clusters, along with the rest of your entire stack.
With Kafka monitoring in New Relic APM 360 you can get:
- Instant real-time Kafka insights: Scrape key client Kafka metrics effortlessly with the Java agent to quickly gain real time insights by connecting the dots across your hosts and service through an unified UI.
- Spot outliers and troubleshoot faster: Instantly spot anomalies in key metrics across all Kafka client components - producers and consumers - to ensure smooth data flow
- Pinpoint bottlenecks: Using latency metrics, throttling rates, queue depth, and retry counts identify bottlenecks that impact data flow and increase latency
- Uncover hidden broker issues: Analyze client-side metrics like producer/consumer throttle time and retry rate growth to detect potential broker-side issues and resource limitations
- Boost data flow with client-side optimization: Identify uncompressed data streams through metrics such as average producer compression ratio and implement efficient compression strategies to shrink data size and improve throughput
