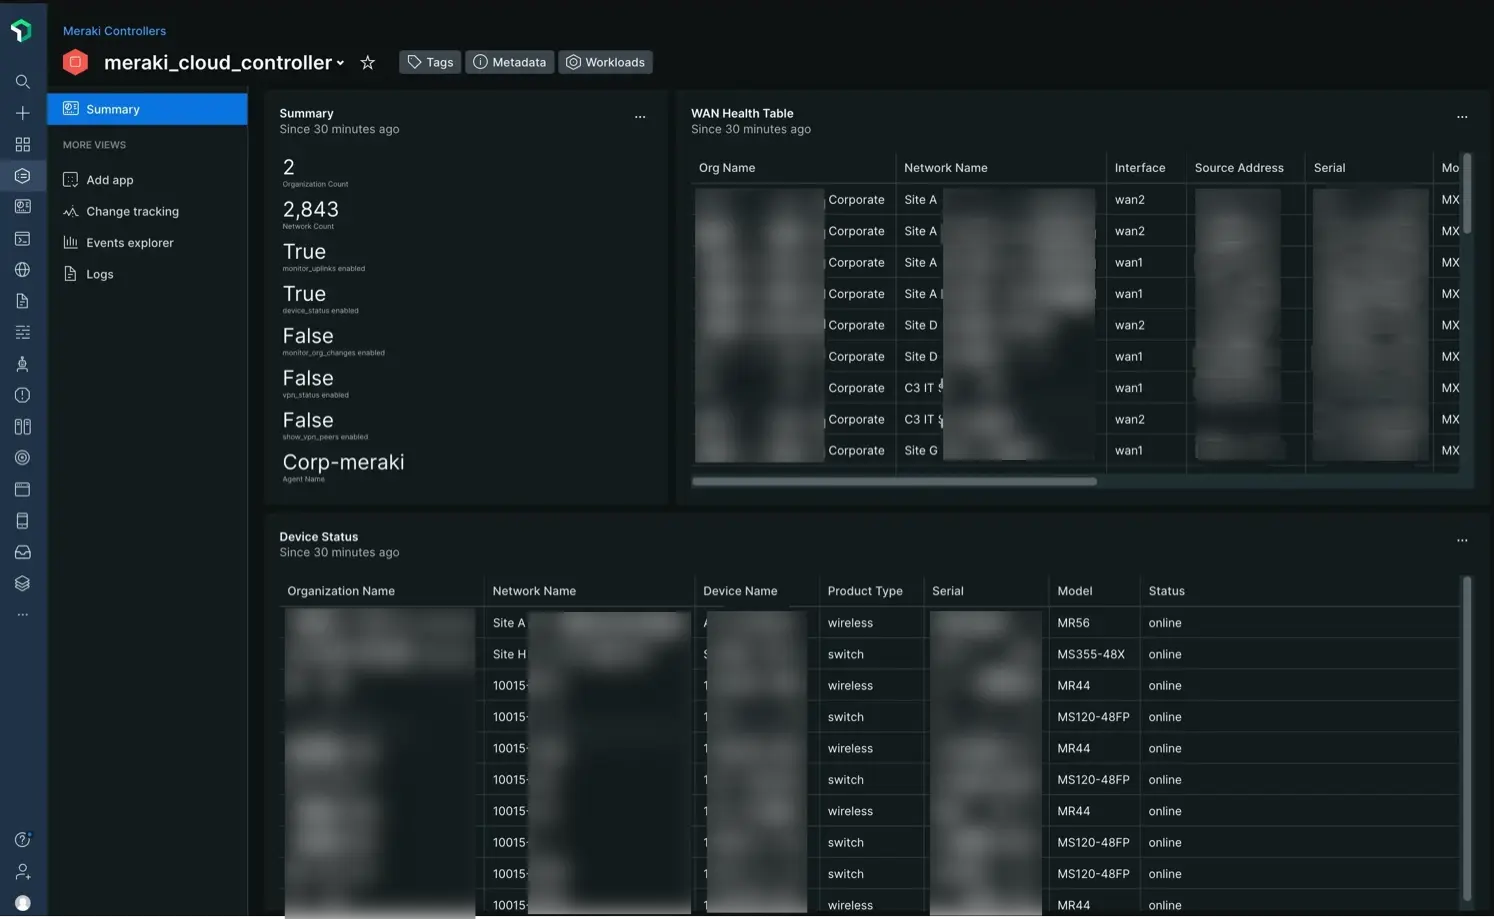
You can use New Relic's network monitoring agent to watch your Meraki environment.
Get started
Before you begin, make sure you have the New Relic, Docker, Podman, Meraki, and Network security prerequisites:
- A New Relic account.
- A New Relic .
- Docker or Podman installed on a Linux host.
- Ability to launch new containers via command line.
- Meraki Dashboard API key for authentication.
Network firewall rules
Direction | Source | Destination | Ports | Protocol | Required |
|---|---|---|---|---|---|
Outbound | Container host |
| 443 | TCP | ✓ |
Outbound | Container host | New Relic Metric API
Endpoint:
| 443 | TCP | ✓ |
Outbound | Container host | New Relic Event API
Endpoint:
| 443 | TCP | ✓ |
Outbound | Container host | New Relic Log API
Endpoint:
| 443 | TCP | |
Outbound | Container host | Meraki Dashboard API endpoint: | 443 (default) | TCP | ✓ |
Installation
You can add Meraki Dashboard API monitoring to an existing SNMP container, or deploy it in a dedicated container and keep it separate from your other SNMP devices. Select the option below that best matches your use case:
In your existing configuration file for the SNMP agent, manually add the Meraki device object. Replace
$MERAKI_DASHBOARD_API_KEYwith your Meraki Dashboard API key:devices:meraki_cloud_controller:device_name: meraki_cloud_controllerdevice_ip: snmp.meraki.comprovider: meraki-cloud-controllerext:ext_only: truemeraki_config:api_key: "$MERAKI_DASHBOARD_API_KEY"Tip
This is a basic example. You can find additional configuration options in our advanced configuration doc.
Stop and remove the existing container:
bash$# Find your current container$docker ps -a$$# Forcibly stop and delete the target container (you may also use the container ID here in place of the name)$docker rm -f $CONTAINER_NAMEStart a fresh container with the updated configuration file. Replace
$CONTAINER_SERVICEwith a unique name for the container and substitute$YOUR_NR_LICENSE_KEYand$YOUR_NR_ACCOUNT_IDwith your values. In this example, it's assumed the default configuration file has the namesnmp-base.yaml:bash$docker run -d --name ktranslate-$CONTAINER_SERVICE \>--restart unless-stopped --pull=always -p 162:1620/udp \>-v `pwd`/snmp-base.yaml:/snmp-base.yaml \>-e NEW_RELIC_API_KEY=$YOUR_NR_LICENSE_KEY \>kentik/ktranslate:v2 \>-snmp /snmp-base.yaml \>-nr_account_id=$YOUR_NR_ACCOUNT_ID \>-metrics=jchf \>-tee_logs=true \>-service_name=$CONTAINER_SERVICE \>-snmp_discovery_on_start=true \>-snmp_discovery_min=180 \>nr1.snmp
On a Linux host with Docker installed, use the text editor of your choice to create the configuration file you'll use to run the container. Replace
$MERAKI_DASHBOARD_API_KEYwith your Meraki Dashboard API key.Example using vim:
bash$sudo vim meraki-base.yamlFile contents:
devices:meraki_cloud_controller:device_name: meraki_cloud_controllerdevice_ip: snmp.meraki.comprovider: meraki-cloud-controllerext:ext_only: truemeraki_config:api_key: "$MERAKI_DASHBOARD_API_KEY"trap: {}discovery: {}global:poll_time_sec: 300timeout_ms: 30000Tip
This is a basic example. You can find additional configuration options in our advanced configuration doc.
Update file permissions to allow Docker to make changes as needed:
bash$chown 1000:1000 meraki-base.yamlStart the network monitoring agent to poll the Meraki Dashboard API. Replace
$CONTAINER_SERVICEwith a unique name for the container and substitute$YOUR_NR_LICENSE_KEYand$YOUR_NR_ACCOUNT_IDwith your values. In this example, we've saved our configuration file as 'meraki-base.yaml':bash$docker run -d --name ktranslate-$CONTAINER_SERVICE \>--restart unless-stopped --pull=always --net=host \>-v `pwd`/meraki-base.yaml:/snmp-base.yaml \>-e NEW_RELIC_API_KEY=$YOUR_NR_LICENSE_KEY \>kentik/ktranslate:v2 \>-snmp /snmp-base.yaml \>-nr_account_id=$YOUR_NR_ACCOUNT_ID \>-metrics=jchf \>-tee_logs=true \>-service_name=$CONTAINER_SERVICE \>nr1.snmp
In your existing configuration file for the SNMP agent, manually add the Meraki device object. Replace
$MERAKI_DASHBOARD_API_KEYwith your Meraki Dashboard API key:devices:meraki_cloud_controller:device_name: meraki_cloud_controllerdevice_ip: snmp.meraki.comprovider: meraki-cloud-controllerext:ext_only: truemeraki_config:api_key: "$MERAKI_DASHBOARD_API_KEY"Tip
This is a basic example. You can find additional configuration options in our advanced configuration doc.
Stop and remove the existing container:
bash$# Find your current container$podman ps -a$$# Forcibly stop and delete the target container (you may also use the container ID here in place of the name)$podman rm -f $CONTAINER_NAMEStart a fresh container with the updated configuration file. Replace
$CONTAINER_SERVICEwith a unique name for the container and substitute$YOUR_NR_LICENSE_KEYand$YOUR_NR_ACCOUNT_IDwith your values. In this example, we're assuming the default configuration file name ofsnmp-base.yaml:bash$podman run -d --name ktranslate-$CONTAINER_SERVICE \>--userns=keep-id --restart unless-stopped --pull=always --net=host \>-v `pwd`/snmp-base.yaml:/snmp-base.yaml \>-e NEW_RELIC_API_KEY=$YOUR_NR_LICENSE_KEY \>kentik/ktranslate:v2 \>-snmp /snmp-base.yaml \>-nr_account_id=$YOUR_NR_ACCOUNT_ID \>-metrics=jchf \>-tee_logs=true \>-service_name=$CONTAINER_SERVICE \>-snmp_discovery_on_start=true \>-snmp_discovery_min=180 \>nr1.snmpImportant
If you haven't already created an
iptablesrule to handle packet redirection for trap messages, you will need to do so with the command:bash$sudo iptables -t nat -A PREROUTING -p udp --dport 162 -j REDIRECT --to-port 1620
On a Linux host with Podman installed, use the text editor of your choice to create the configuration file you'll use to run the container. Replace
$MERAKI_DASHBOARD_API_KEYwith your Meraki Dashboard API key.Example using vim:
bash$sudo vim meraki-base.yamlFile contents:
devices:meraki_cloud_controller:device_name: meraki_cloud_controllerdevice_ip: snmp.meraki.comprovider: meraki-cloud-controllerext:ext_only: truemeraki_config:api_key: "$MERAKI_DASHBOARD_API_KEY"trap: {}discovery: {}global:poll_time_sec: 300timeout_ms: 30000Tip
This is a basic example. You can find additional configuration options in our advanced configuration doc.
Update file permissions to allow Podman to make changes as needed:
bash$chown 1000:1000 meraki-base.yamlStart the network monitoring agent to poll the Meraki Dashboard API. Replace
$CONTAINER_SERVICEwith a unique name for the container and substitute$YOUR_NR_LICENSE_KEYand$YOUR_NR_ACCOUNT_IDwith your values. In this example, we have saved our configuration file as 'meraki-base.yaml':bash$podman run -d --name ktranslate-$CONTAINER_SERVICE \>--userns=keep-id --restart unless-stopped --pull=always --net=host \>-v `pwd`/snmp-base.yaml:/snmp-base.yaml \>-e NEW_RELIC_API_KEY=$YOUR_NR_LICENSE_KEY \>kentik/ktranslate:v2 \>-snmp /snmp-base.yaml \>-nr_account_id=$YOUR_NR_ACCOUNT_ID \>-metrics=jchf \>-tee_logs=true \>-service_name=$CONTAINER_SERVICE \>nr1.snmpImportant
If you haven't already created an
iptablesrule to handle packet redirection for trap messages, you will need to do so with the command:bash$sudo iptables -t nat -A PREROUTING -p udp --dport 162 -j REDIRECT --to-port 1620
What's next
You can set up more agents to complement your Meraki environment data:
To get better visibility into how your network is used, set up network flow data monitoring.
To get insights into system messages from your devices, setup network syslog collection.