The WebSocket API allows opening a two-way interactive communication session between the user's browser and a server. This session allows sending and receiving data without polling for a server response. With New Relic browser monitoring, you can monitor and track the traffic and health of your websocket sessions.
Websockets data from the API are recorded as WebSocket events by the browser agent. These events include metrics about the connection, messages received, data sent, and how the connection was closed during the lifecycle of the websocket.
Why use websockets monitoring?
Automatic tracking of websockets with New Relic provides the tools and insights into making sure your websockets work as expected. With WebSocket events, you can:
- Monitor bytes sent and received of your network connections
- Examine whether websockets close successfully or not and the reason as to why
- Troubleshoot JavaScript errors that occur during the lifecycle of your websockets
- Build custom dashboards and alerts based on websockets
Prerequisites
- A Pro or Pro + SPA browser agent, version 1.318.0 or higher.
Important
Websockets monitoring is not available for the Lite browser agent.
Enable automatic collection
Enhance your application's observability and debugging capabilities by following these simple setup instructions.
Go to one.newrelic.com > All Capabilities > Browser.
Select your browser app.
In the left-hand menu, click Application settings.
Ensure the Pro or Pro + SPA browser agent is selected.
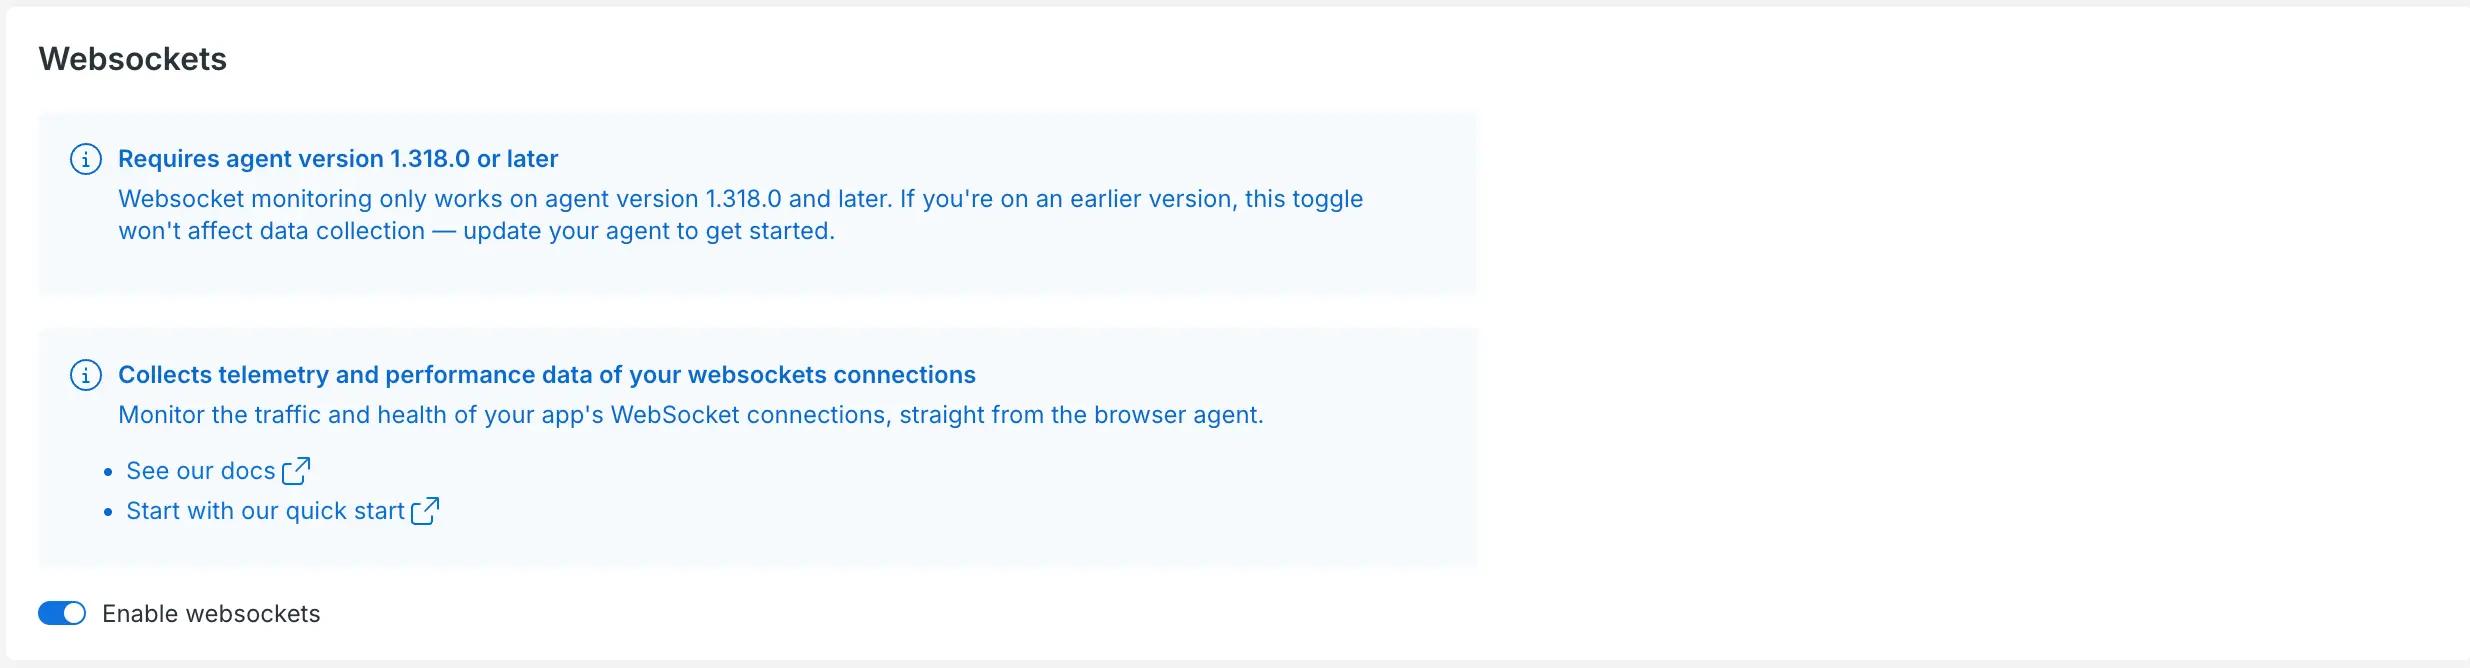
Turn on Enable websockets.
Disable websockets collection
To disable websockets for an existing browser app:
Go to one.newrelic.com > All Capabilities > Browser.
Select your browser app.
In the left-hand menu, click Application settings.
To disable websockets, turn off Enable websockets.
Data consumption
WebSocket events follow the same consumption pricing as your other browser bytes. The amount of bytes produced depends on the count and attributes of the data.
Once enabled, the agent will automatically capture websockets as they occur in your application.
Find your data in New Relic
Websockets are stored as WebSocket events in New Relic. See the data dictionary for more information on the fields available for use with WebSocket events. For a quick and useful dashboard, see this quickstart. You can query and visualize this data to gain insights into your application's performance:
Measure total amount of websocket instances over time
FROM WebSocketSELECT count(*)TIMESERIESView reasons why websockets close unexpectedly
FROM WebSocketSELECT count(*)FACET closeReasonTrack websockets with errors
FROM WebSocketSELECT count(*) AS 'Errors'WHERE hasErrors IS trueTIMESERIESView average bytes sent and received
FROM WebSocketSELECT average(sendBytes), average(messageBytes)WHERE messageCount IS NOT nullTIMESERIESMonitor websocket average duration
FROM WebSocketSELECT average(connectedDuration)FACET cases( WHERE closeWasClean IS true AS 'Connected - Clean', WHERE closeWasClean IS NOT true AS 'Connected - Dirty')TIMESERIESUse these queries or create your own to build custom dashboards, set up alerts, and monitor the real-world performance of your web applications with precision.
Conseil
Need help or want to learn more about using websockets in New Relic? Visit our documentation or reach out to support.newrelic.com.