Kubernetes monitoring in New Relic now opens on a fleet-wide triage view instead of an entity list.
Finding the problem in a large Kubernetes estate used to mean scanning a list of entities and knowing what to look for. Now the page shows what needs attention across every cluster you run, ranks the worst offenders first, and lets you drill straight into the problem.
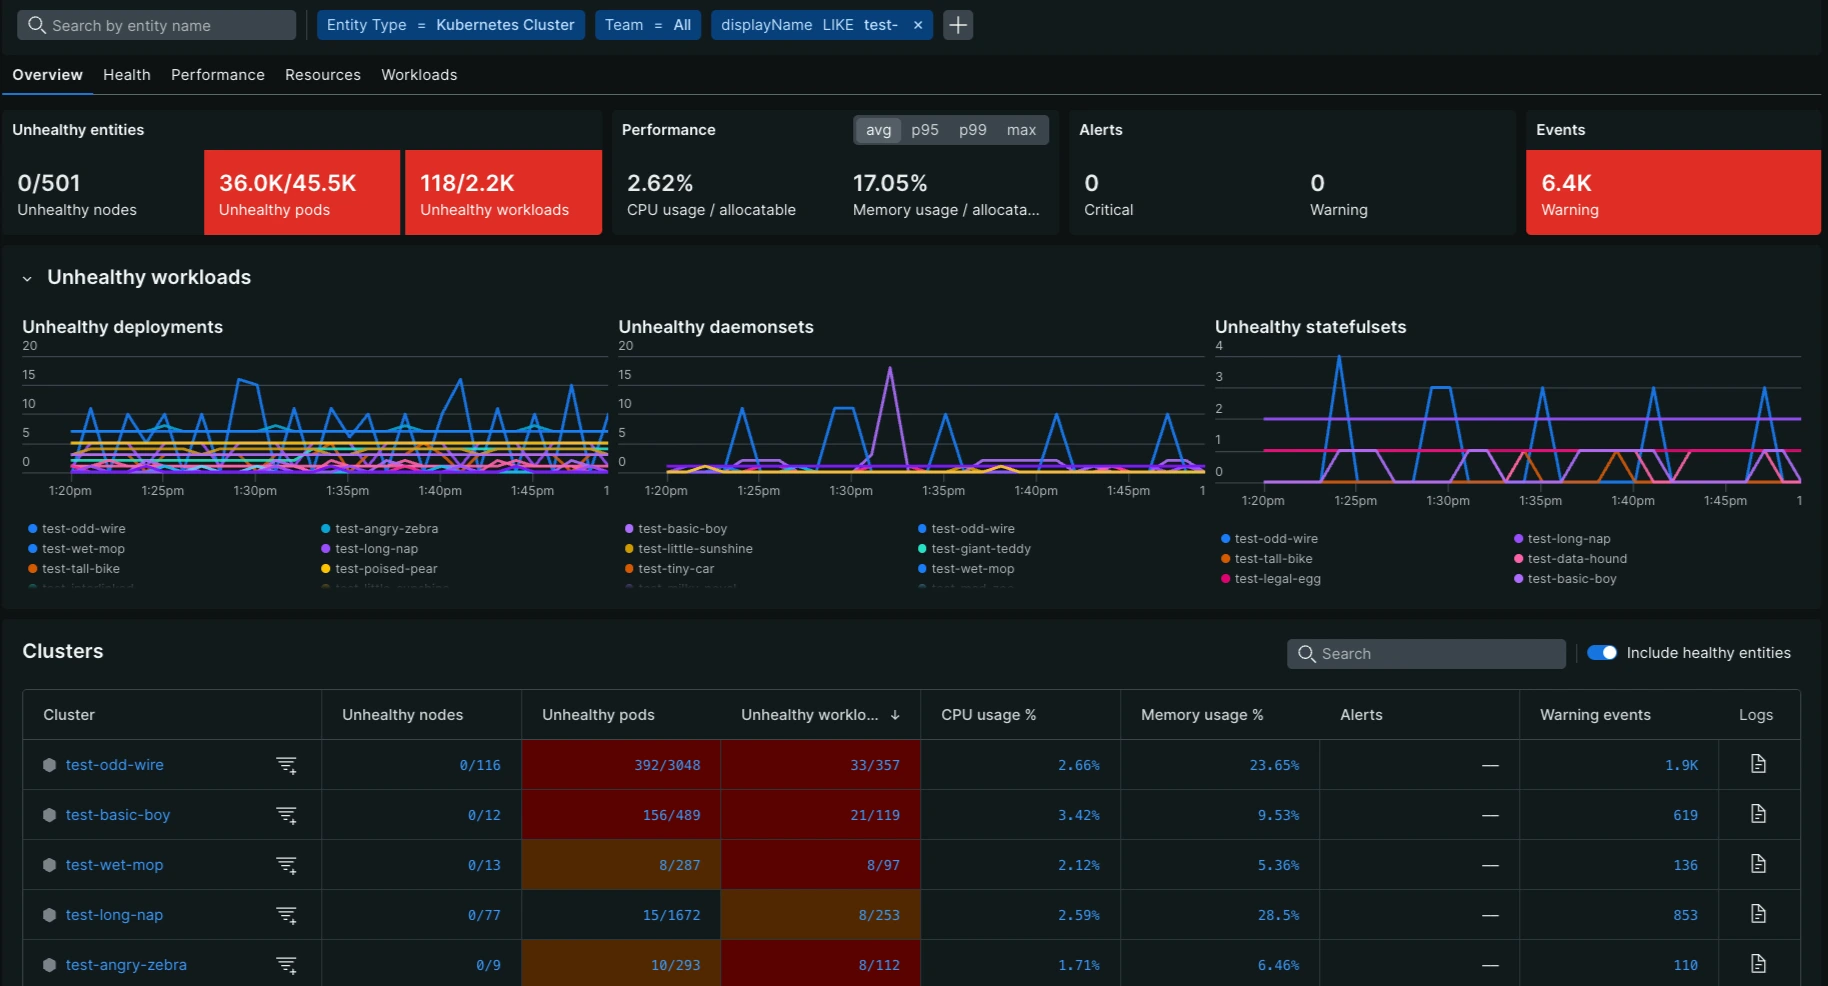
How the triage flow works
- Scorecards surface what's wrong across the whole fleet, scored against severity thresholds drawn from operational practice. Ephemeral storage is flagged before it takes the Kubelet down. Memory is flagged as it approaches limits, before an OOMKill. CPU throttling is flagged as latency, not as a number you have to interpret.
- Click a scorecard and the table re-ranks, putting the clusters and nodes with the worst values for that metric at the top.
- Click a metric and you're in the drill-down, already filtered to that cluster and metric, with your namespace filters carried across so you don't have to reapply them.
Five views organize the fleet: Overview, Health, Performance, Resources, and Workloads.
What else you get
- One view across accounts. Clusters from the New Relic accounts you have access to appear together, so a fleet that spans accounts no longer means switching context to monitor it.
- Entity popovers. Select any entity for its golden metrics, related entities, and the object manifest, without leaving the page.
- APM, events, logs, and alerts in context. APM data, Kubernetes events, and logs open in a stacked view alongside infrastructure health, so you can correlate signals and reduce MTTR without losing your place. Open alerts stay visible even when your selected time range would otherwise hide them.
- Flexible instrumentation. Works with New Relic agents or with OpenTelemetry.
- Resource waste, surfaced. The Resources view compares usage against requests and limits, so over- and under-provisioned workloads show up without building a query.
- Columns you control. The Workloads view ships a lean default column set, lets you add what you need, and remembers your choice.
The previous Kubernetes entity explorer remains available through the view toggle. Learn more.